Asian vs Immigrants from Czechoslovakia 11th Grade
COMPARE
Asian
Immigrants from Czechoslovakia
11th Grade
11th Grade Comparison
Asians
Immigrants from Czechoslovakia
92.5%
11TH GRADE
50.0/ 100
METRIC RATING
174th/ 347
METRIC RANK
93.8%
11TH GRADE
99.6/ 100
METRIC RATING
74th/ 347
METRIC RANK
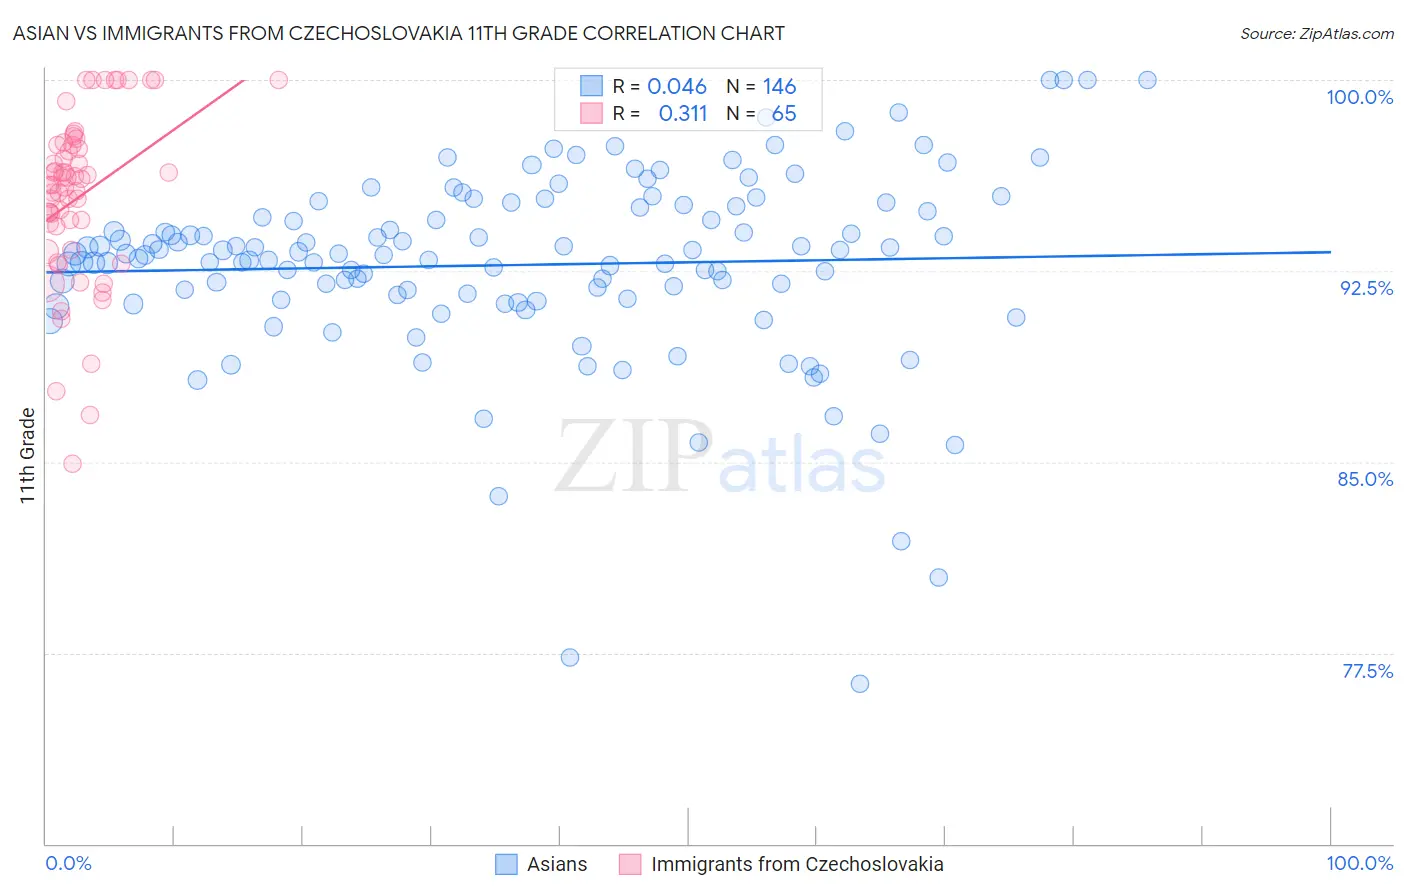
Asian vs Immigrants from Czechoslovakia 11th Grade Correlation Chart
The statistical analysis conducted on geographies consisting of 550,778,127 people shows no correlation between the proportion of Asians and percentage of population with at least 11th grade education in the United States with a correlation coefficient (R) of 0.046 and weighted average of 92.5%. Similarly, the statistical analysis conducted on geographies consisting of 195,448,106 people shows a mild positive correlation between the proportion of Immigrants from Czechoslovakia and percentage of population with at least 11th grade education in the United States with a correlation coefficient (R) of 0.311 and weighted average of 93.8%, a difference of 1.4%.
11th Grade Correlation Summary
| Measurement | Asian | Immigrants from Czechoslovakia |
| Minimum | 76.3% | 84.9% |
| Maximum | 100.0% | 100.0% |
| Range | 23.7% | 15.1% |
| Mean | 92.7% | 95.4% |
| Median | 93.2% | 95.9% |
| Interquartile 25% (IQ1) | 91.4% | 93.8% |
| Interquartile 75% (IQ3) | 95.0% | 97.4% |
| Interquartile Range (IQR) | 3.6% | 3.7% |
| Standard Deviation (Sample) | 3.8% | 3.3% |
| Standard Deviation (Population) | 3.7% | 3.3% |
Similar Demographics by 11th Grade
Demographics Similar to Asians by 11th Grade
In terms of 11th grade, the demographic groups most similar to Asians are Shoshone (92.5%, a difference of 0.010%), Immigrants from Pakistan (92.5%, a difference of 0.020%), Indian (Asian) (92.5%, a difference of 0.020%), Spaniard (92.5%, a difference of 0.030%), and Laotian (92.6%, a difference of 0.040%).
| Demographics | Rating | Rank | 11th Grade |
| Alsatians | 60.2 /100 | #167 | Good 92.6% |
| Sierra Leoneans | 58.7 /100 | #168 | Average 92.6% |
| Immigrants | Albania | 57.8 /100 | #169 | Average 92.6% |
| Immigrants | Northern Africa | 57.3 /100 | #170 | Average 92.6% |
| Laotians | 54.4 /100 | #171 | Average 92.6% |
| Immigrants | Pakistan | 52.3 /100 | #172 | Average 92.5% |
| Indians (Asian) | 51.5 /100 | #173 | Average 92.5% |
| Asians | 50.0 /100 | #174 | Average 92.5% |
| Shoshone | 48.9 /100 | #175 | Average 92.5% |
| Spaniards | 46.9 /100 | #176 | Average 92.5% |
| Guamanians/Chamorros | 45.0 /100 | #177 | Average 92.5% |
| Sudanese | 43.4 /100 | #178 | Average 92.5% |
| Creek | 40.9 /100 | #179 | Average 92.4% |
| Inupiat | 40.7 /100 | #180 | Average 92.4% |
| Cherokee | 40.7 /100 | #181 | Average 92.4% |
Demographics Similar to Immigrants from Czechoslovakia by 11th Grade
In terms of 11th grade, the demographic groups most similar to Immigrants from Czechoslovakia are Romanian (93.8%, a difference of 0.0%), Immigrants from Japan (93.8%, a difference of 0.020%), Immigrants from Latvia (93.8%, a difference of 0.020%), Immigrants from South Africa (93.8%, a difference of 0.050%), and Celtic (93.7%, a difference of 0.050%).
| Demographics | Rating | Rank | 11th Grade |
| Immigrants | Netherlands | 99.8 /100 | #67 | Exceptional 93.9% |
| Zimbabweans | 99.8 /100 | #68 | Exceptional 93.9% |
| Scotch-Irish | 99.8 /100 | #69 | Exceptional 93.9% |
| Immigrants | England | 99.7 /100 | #70 | Exceptional 93.8% |
| Immigrants | South Africa | 99.7 /100 | #71 | Exceptional 93.8% |
| Immigrants | Japan | 99.7 /100 | #72 | Exceptional 93.8% |
| Romanians | 99.6 /100 | #73 | Exceptional 93.8% |
| Immigrants | Czechoslovakia | 99.6 /100 | #74 | Exceptional 93.8% |
| Immigrants | Latvia | 99.6 /100 | #75 | Exceptional 93.8% |
| Celtics | 99.5 /100 | #76 | Exceptional 93.7% |
| Aleuts | 99.5 /100 | #77 | Exceptional 93.7% |
| Soviet Union | 99.5 /100 | #78 | Exceptional 93.7% |
| Immigrants | Denmark | 99.5 /100 | #79 | Exceptional 93.7% |
| Canadians | 99.5 /100 | #80 | Exceptional 93.7% |
| Immigrants | Moldova | 99.5 /100 | #81 | Exceptional 93.7% |