Asian vs Greek Median Earnings
COMPARE
Asian
Greek
Median Earnings
Median Earnings Comparison
Asians
Greeks
$53,690
MEDIAN EARNINGS
100.0/ 100
METRIC RATING
27th/ 347
METRIC RANK
$51,164
MEDIAN EARNINGS
99.9/ 100
METRIC RATING
65th/ 347
METRIC RANK
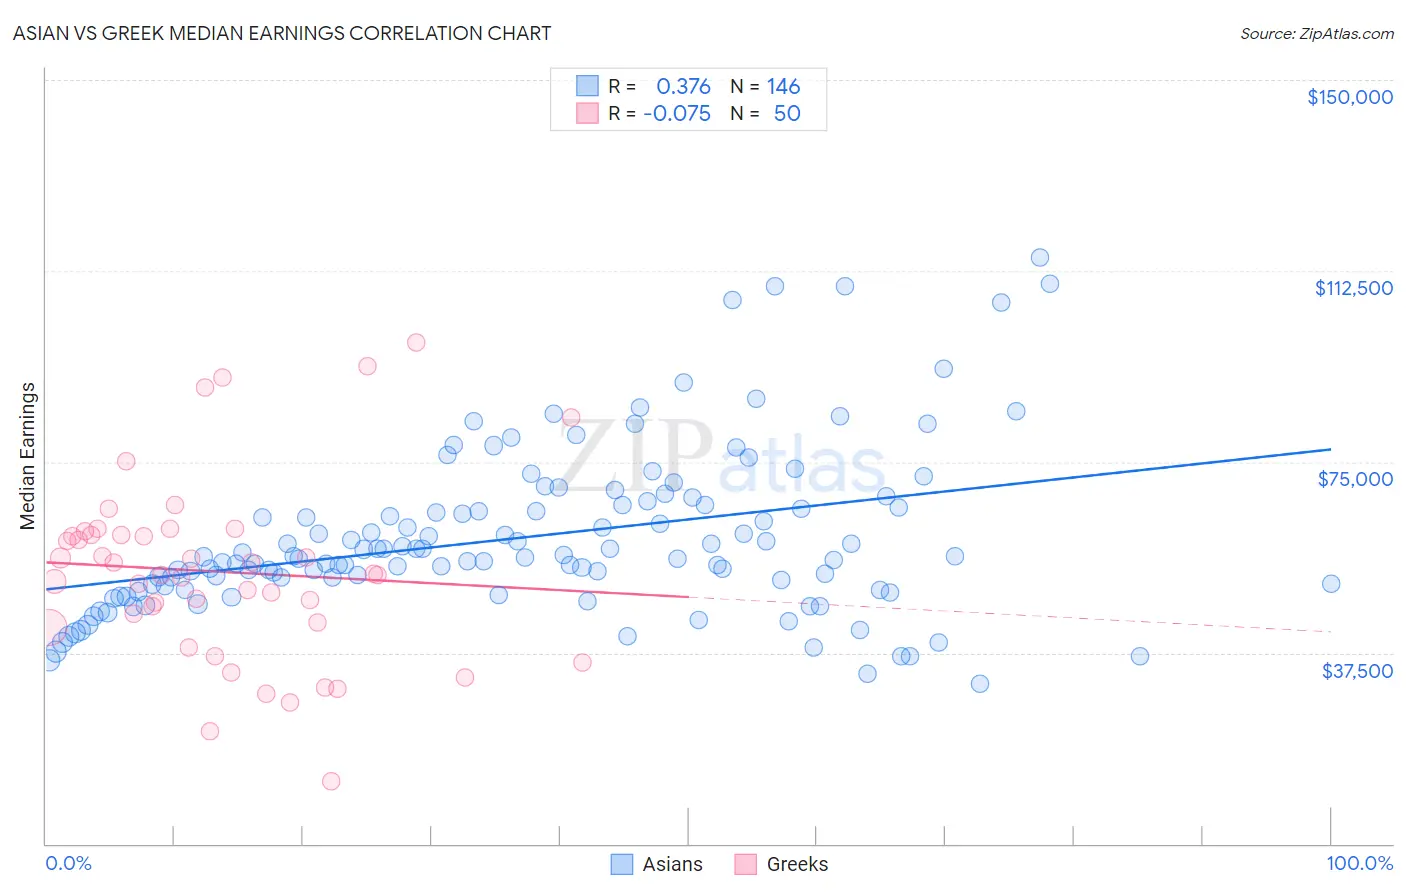
Asian vs Greek Median Earnings Correlation Chart
The statistical analysis conducted on geographies consisting of 550,727,448 people shows a mild positive correlation between the proportion of Asians and median earnings in the United States with a correlation coefficient (R) of 0.376 and weighted average of $53,690. Similarly, the statistical analysis conducted on geographies consisting of 482,719,843 people shows a slight negative correlation between the proportion of Greeks and median earnings in the United States with a correlation coefficient (R) of -0.075 and weighted average of $51,164, a difference of 4.9%.
Median Earnings Correlation Summary
| Measurement | Asian | Greek |
| Minimum | $31,416 | $12,321 |
| Maximum | $115,028 | $98,462 |
| Range | $83,612 | $86,141 |
| Mean | $60,136 | $53,439 |
| Median | $56,241 | $52,981 |
| Interquartile 25% (IQ1) | $50,602 | $43,544 |
| Interquartile 75% (IQ3) | $66,425 | $60,703 |
| Interquartile Range (IQR) | $15,823 | $17,159 |
| Standard Deviation (Sample) | $16,173 | $17,942 |
| Standard Deviation (Population) | $16,117 | $17,762 |
Similar Demographics by Median Earnings
Demographics Similar to Asians by Median Earnings
In terms of median earnings, the demographic groups most similar to Asians are Immigrants from Northern Europe ($53,872, a difference of 0.34%), Immigrants from France ($53,490, a difference of 0.37%), Turkish ($53,919, a difference of 0.43%), Immigrants from Russia ($53,457, a difference of 0.43%), and Cambodian ($53,386, a difference of 0.57%).
| Demographics | Rating | Rank | Median Earnings |
| Cypriots | 100.0 /100 | #20 | Exceptional $54,589 |
| Burmese | 100.0 /100 | #21 | Exceptional $54,559 |
| Immigrants | Korea | 100.0 /100 | #22 | Exceptional $54,530 |
| Immigrants | Sweden | 100.0 /100 | #23 | Exceptional $54,478 |
| Soviet Union | 100.0 /100 | #24 | Exceptional $54,290 |
| Turks | 100.0 /100 | #25 | Exceptional $53,919 |
| Immigrants | Northern Europe | 100.0 /100 | #26 | Exceptional $53,872 |
| Asians | 100.0 /100 | #27 | Exceptional $53,690 |
| Immigrants | France | 100.0 /100 | #28 | Exceptional $53,490 |
| Immigrants | Russia | 100.0 /100 | #29 | Exceptional $53,457 |
| Cambodians | 100.0 /100 | #30 | Exceptional $53,386 |
| Russians | 100.0 /100 | #31 | Exceptional $53,334 |
| Immigrants | Asia | 100.0 /100 | #32 | Exceptional $53,310 |
| Immigrants | Greece | 100.0 /100 | #33 | Exceptional $53,282 |
| Immigrants | Sri Lanka | 100.0 /100 | #34 | Exceptional $53,268 |
Demographics Similar to Greeks by Median Earnings
In terms of median earnings, the demographic groups most similar to Greeks are Afghan ($51,112, a difference of 0.10%), Immigrants from Spain ($51,092, a difference of 0.14%), New Zealander ($51,246, a difference of 0.16%), Paraguayan ($51,068, a difference of 0.19%), and Mongolian ($51,038, a difference of 0.25%).
| Demographics | Rating | Rank | Median Earnings |
| Immigrants | Bolivia | 99.9 /100 | #58 | Exceptional $51,605 |
| Immigrants | Croatia | 99.9 /100 | #59 | Exceptional $51,581 |
| Immigrants | Serbia | 99.9 /100 | #60 | Exceptional $51,557 |
| Immigrants | Latvia | 99.9 /100 | #61 | Exceptional $51,555 |
| Immigrants | Romania | 99.9 /100 | #62 | Exceptional $51,337 |
| Immigrants | Bulgaria | 99.9 /100 | #63 | Exceptional $51,318 |
| New Zealanders | 99.9 /100 | #64 | Exceptional $51,246 |
| Greeks | 99.9 /100 | #65 | Exceptional $51,164 |
| Afghans | 99.9 /100 | #66 | Exceptional $51,112 |
| Immigrants | Spain | 99.9 /100 | #67 | Exceptional $51,092 |
| Paraguayans | 99.9 /100 | #68 | Exceptional $51,068 |
| Mongolians | 99.8 /100 | #69 | Exceptional $51,038 |
| Lithuanians | 99.8 /100 | #70 | Exceptional $50,991 |
| Immigrants | Ukraine | 99.8 /100 | #71 | Exceptional $50,984 |
| Immigrants | Egypt | 99.8 /100 | #72 | Exceptional $50,901 |