Asian vs Laotian Median Earnings
COMPARE
Asian
Laotian
Median Earnings
Median Earnings Comparison
Asians
Laotians
$53,690
MEDIAN EARNINGS
100.0/ 100
METRIC RATING
27th/ 347
METRIC RANK
$50,343
MEDIAN EARNINGS
99.6/ 100
METRIC RATING
79th/ 347
METRIC RANK
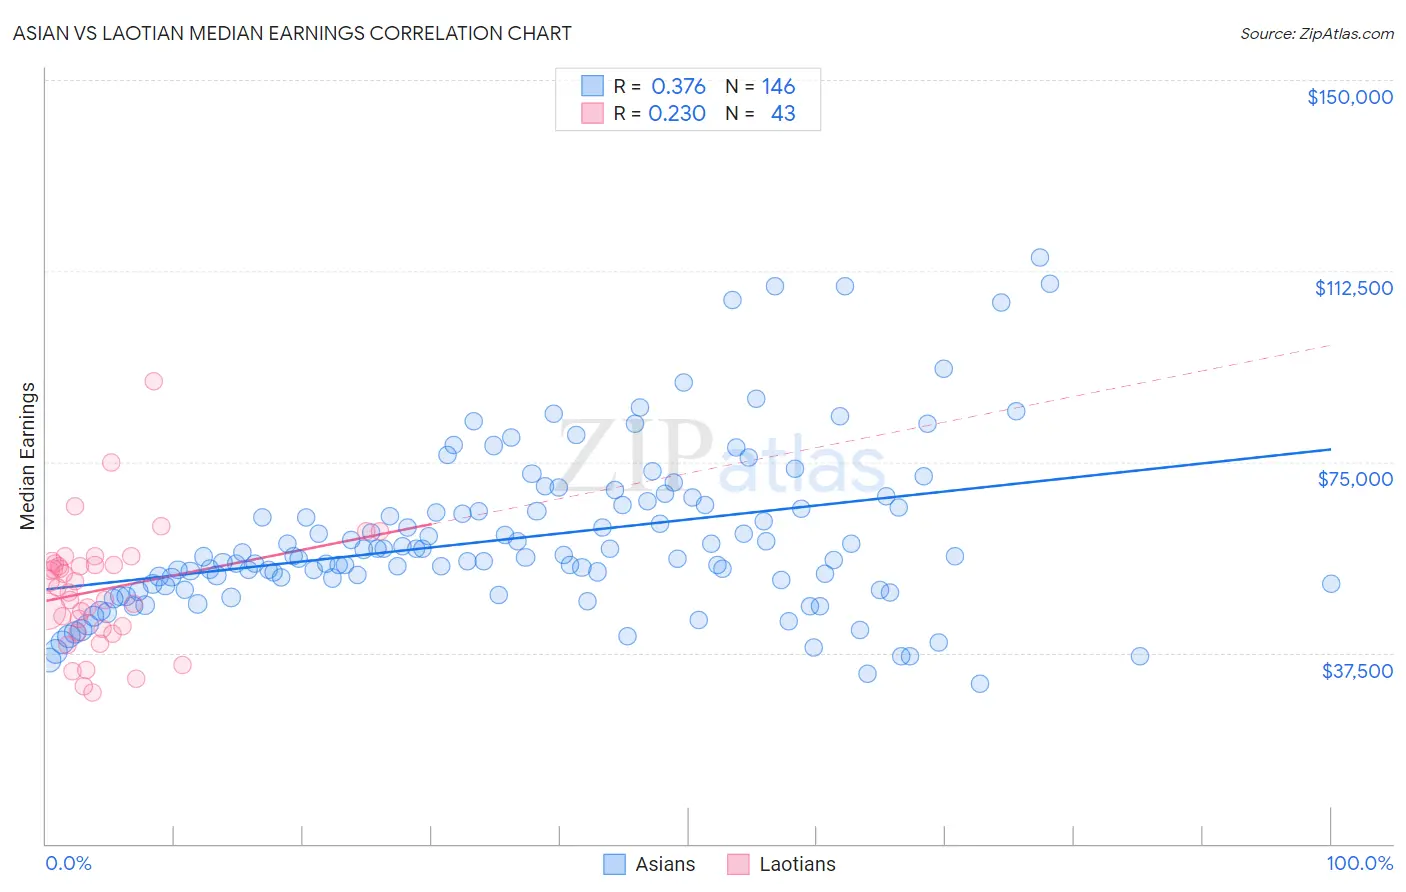
Asian vs Laotian Median Earnings Correlation Chart
The statistical analysis conducted on geographies consisting of 550,727,448 people shows a mild positive correlation between the proportion of Asians and median earnings in the United States with a correlation coefficient (R) of 0.376 and weighted average of $53,690. Similarly, the statistical analysis conducted on geographies consisting of 224,848,117 people shows a weak positive correlation between the proportion of Laotians and median earnings in the United States with a correlation coefficient (R) of 0.230 and weighted average of $50,343, a difference of 6.7%.
Median Earnings Correlation Summary
| Measurement | Asian | Laotian |
| Minimum | $31,416 | $29,751 |
| Maximum | $115,028 | $90,729 |
| Range | $83,612 | $60,978 |
| Mean | $60,136 | $49,880 |
| Median | $56,241 | $50,359 |
| Interquartile 25% (IQ1) | $50,602 | $42,206 |
| Interquartile 75% (IQ3) | $66,425 | $55,106 |
| Interquartile Range (IQR) | $15,823 | $12,900 |
| Standard Deviation (Sample) | $16,173 | $11,670 |
| Standard Deviation (Population) | $16,117 | $11,533 |
Similar Demographics by Median Earnings
Demographics Similar to Asians by Median Earnings
In terms of median earnings, the demographic groups most similar to Asians are Immigrants from Northern Europe ($53,872, a difference of 0.34%), Immigrants from France ($53,490, a difference of 0.37%), Turkish ($53,919, a difference of 0.43%), Immigrants from Russia ($53,457, a difference of 0.43%), and Cambodian ($53,386, a difference of 0.57%).
| Demographics | Rating | Rank | Median Earnings |
| Cypriots | 100.0 /100 | #20 | Exceptional $54,589 |
| Burmese | 100.0 /100 | #21 | Exceptional $54,559 |
| Immigrants | Korea | 100.0 /100 | #22 | Exceptional $54,530 |
| Immigrants | Sweden | 100.0 /100 | #23 | Exceptional $54,478 |
| Soviet Union | 100.0 /100 | #24 | Exceptional $54,290 |
| Turks | 100.0 /100 | #25 | Exceptional $53,919 |
| Immigrants | Northern Europe | 100.0 /100 | #26 | Exceptional $53,872 |
| Asians | 100.0 /100 | #27 | Exceptional $53,690 |
| Immigrants | France | 100.0 /100 | #28 | Exceptional $53,490 |
| Immigrants | Russia | 100.0 /100 | #29 | Exceptional $53,457 |
| Cambodians | 100.0 /100 | #30 | Exceptional $53,386 |
| Russians | 100.0 /100 | #31 | Exceptional $53,334 |
| Immigrants | Asia | 100.0 /100 | #32 | Exceptional $53,310 |
| Immigrants | Greece | 100.0 /100 | #33 | Exceptional $53,282 |
| Immigrants | Sri Lanka | 100.0 /100 | #34 | Exceptional $53,268 |
Demographics Similar to Laotians by Median Earnings
In terms of median earnings, the demographic groups most similar to Laotians are Ukrainian ($50,320, a difference of 0.050%), Argentinean ($50,399, a difference of 0.11%), Immigrants from Southern Europe ($50,280, a difference of 0.12%), Immigrants from Moldova ($50,274, a difference of 0.14%), and Romanian ($50,244, a difference of 0.20%).
| Demographics | Rating | Rank | Median Earnings |
| Immigrants | Egypt | 99.8 /100 | #72 | Exceptional $50,901 |
| Immigrants | Netherlands | 99.8 /100 | #73 | Exceptional $50,818 |
| South Africans | 99.8 /100 | #74 | Exceptional $50,752 |
| Immigrants | Scotland | 99.8 /100 | #75 | Exceptional $50,741 |
| Immigrants | Italy | 99.7 /100 | #76 | Exceptional $50,581 |
| Immigrants | Western Europe | 99.7 /100 | #77 | Exceptional $50,549 |
| Argentineans | 99.6 /100 | #78 | Exceptional $50,399 |
| Laotians | 99.6 /100 | #79 | Exceptional $50,343 |
| Ukrainians | 99.6 /100 | #80 | Exceptional $50,320 |
| Immigrants | Southern Europe | 99.6 /100 | #81 | Exceptional $50,280 |
| Immigrants | Moldova | 99.5 /100 | #82 | Exceptional $50,274 |
| Romanians | 99.5 /100 | #83 | Exceptional $50,244 |
| Immigrants | Hungary | 99.5 /100 | #84 | Exceptional $50,227 |
| Immigrants | Kazakhstan | 99.5 /100 | #85 | Exceptional $50,225 |
| Immigrants | Canada | 99.5 /100 | #86 | Exceptional $50,192 |