Asian vs Delaware Median Earnings
COMPARE
Asian
Delaware
Median Earnings
Median Earnings Comparison
Asians
Delaware
$53,690
MEDIAN EARNINGS
100.0/ 100
METRIC RATING
27th/ 347
METRIC RANK
$44,783
MEDIAN EARNINGS
9.0/ 100
METRIC RATING
232nd/ 347
METRIC RANK
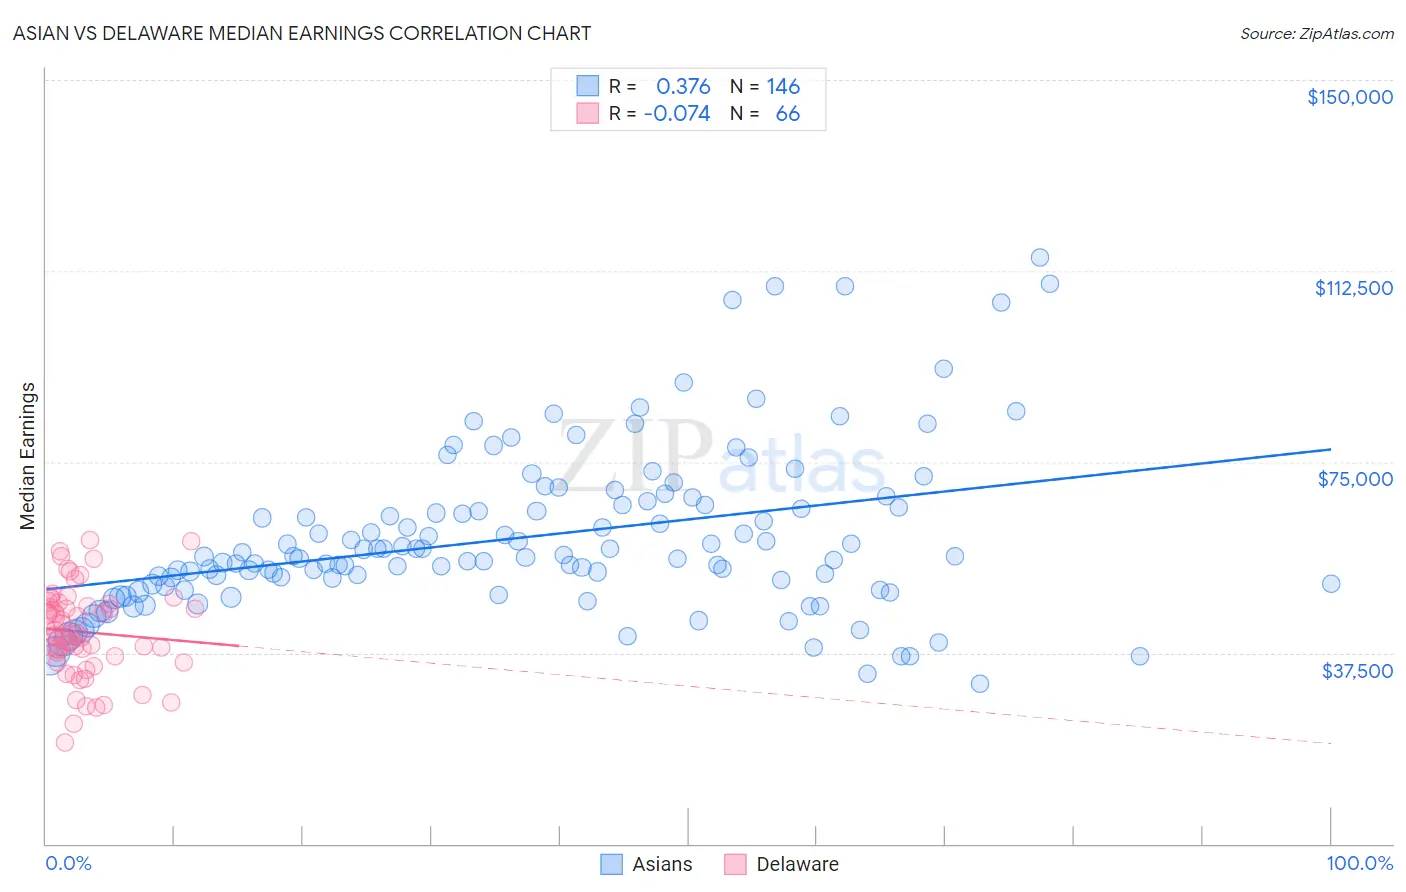
Asian vs Delaware Median Earnings Correlation Chart
The statistical analysis conducted on geographies consisting of 550,727,448 people shows a mild positive correlation between the proportion of Asians and median earnings in the United States with a correlation coefficient (R) of 0.376 and weighted average of $53,690. Similarly, the statistical analysis conducted on geographies consisting of 96,235,383 people shows a slight negative correlation between the proportion of Delaware and median earnings in the United States with a correlation coefficient (R) of -0.074 and weighted average of $44,783, a difference of 19.9%.
Median Earnings Correlation Summary
| Measurement | Asian | Delaware |
| Minimum | $31,416 | $19,766 |
| Maximum | $115,028 | $59,711 |
| Range | $83,612 | $39,945 |
| Mean | $60,136 | $41,572 |
| Median | $56,241 | $41,074 |
| Interquartile 25% (IQ1) | $50,602 | $36,711 |
| Interquartile 75% (IQ3) | $66,425 | $47,149 |
| Interquartile Range (IQR) | $15,823 | $10,438 |
| Standard Deviation (Sample) | $16,173 | $8,740 |
| Standard Deviation (Population) | $16,117 | $8,674 |
Similar Demographics by Median Earnings
Demographics Similar to Asians by Median Earnings
In terms of median earnings, the demographic groups most similar to Asians are Immigrants from Northern Europe ($53,872, a difference of 0.34%), Immigrants from France ($53,490, a difference of 0.37%), Turkish ($53,919, a difference of 0.43%), Immigrants from Russia ($53,457, a difference of 0.43%), and Cambodian ($53,386, a difference of 0.57%).
| Demographics | Rating | Rank | Median Earnings |
| Cypriots | 100.0 /100 | #20 | Exceptional $54,589 |
| Burmese | 100.0 /100 | #21 | Exceptional $54,559 |
| Immigrants | Korea | 100.0 /100 | #22 | Exceptional $54,530 |
| Immigrants | Sweden | 100.0 /100 | #23 | Exceptional $54,478 |
| Soviet Union | 100.0 /100 | #24 | Exceptional $54,290 |
| Turks | 100.0 /100 | #25 | Exceptional $53,919 |
| Immigrants | Northern Europe | 100.0 /100 | #26 | Exceptional $53,872 |
| Asians | 100.0 /100 | #27 | Exceptional $53,690 |
| Immigrants | France | 100.0 /100 | #28 | Exceptional $53,490 |
| Immigrants | Russia | 100.0 /100 | #29 | Exceptional $53,457 |
| Cambodians | 100.0 /100 | #30 | Exceptional $53,386 |
| Russians | 100.0 /100 | #31 | Exceptional $53,334 |
| Immigrants | Asia | 100.0 /100 | #32 | Exceptional $53,310 |
| Immigrants | Greece | 100.0 /100 | #33 | Exceptional $53,282 |
| Immigrants | Sri Lanka | 100.0 /100 | #34 | Exceptional $53,268 |
Demographics Similar to Delaware by Median Earnings
In terms of median earnings, the demographic groups most similar to Delaware are Immigrants from Sudan ($44,767, a difference of 0.040%), Japanese ($44,825, a difference of 0.090%), Immigrants from Western Africa ($44,893, a difference of 0.24%), Scotch-Irish ($44,924, a difference of 0.32%), and Cape Verdean ($44,640, a difference of 0.32%).
| Demographics | Rating | Rank | Median Earnings |
| Immigrants | Cambodia | 13.2 /100 | #225 | Poor $45,090 |
| Immigrants | Nigeria | 12.2 /100 | #226 | Poor $45,030 |
| Native Hawaiians | 12.2 /100 | #227 | Poor $45,027 |
| Immigrants | Iraq | 11.6 /100 | #228 | Poor $44,988 |
| Scotch-Irish | 10.7 /100 | #229 | Poor $44,924 |
| Immigrants | Western Africa | 10.3 /100 | #230 | Poor $44,893 |
| Japanese | 9.5 /100 | #231 | Tragic $44,825 |
| Delaware | 9.0 /100 | #232 | Tragic $44,783 |
| Immigrants | Sudan | 8.8 /100 | #233 | Tragic $44,767 |
| Cape Verdeans | 7.5 /100 | #234 | Tragic $44,640 |
| Venezuelans | 6.9 /100 | #235 | Tragic $44,580 |
| British West Indians | 6.7 /100 | #236 | Tragic $44,552 |
| Immigrants | Ecuador | 5.9 /100 | #237 | Tragic $44,462 |
| Sudanese | 5.6 /100 | #238 | Tragic $44,419 |
| Senegalese | 5.3 /100 | #239 | Tragic $44,373 |