Asian vs Immigrants from Caribbean Median Earnings
COMPARE
Asian
Immigrants from Caribbean
Median Earnings
Median Earnings Comparison
Asians
Immigrants from Caribbean
$53,690
MEDIAN EARNINGS
100.0/ 100
METRIC RATING
27th/ 347
METRIC RANK
$41,119
MEDIAN EARNINGS
0.1/ 100
METRIC RATING
299th/ 347
METRIC RANK
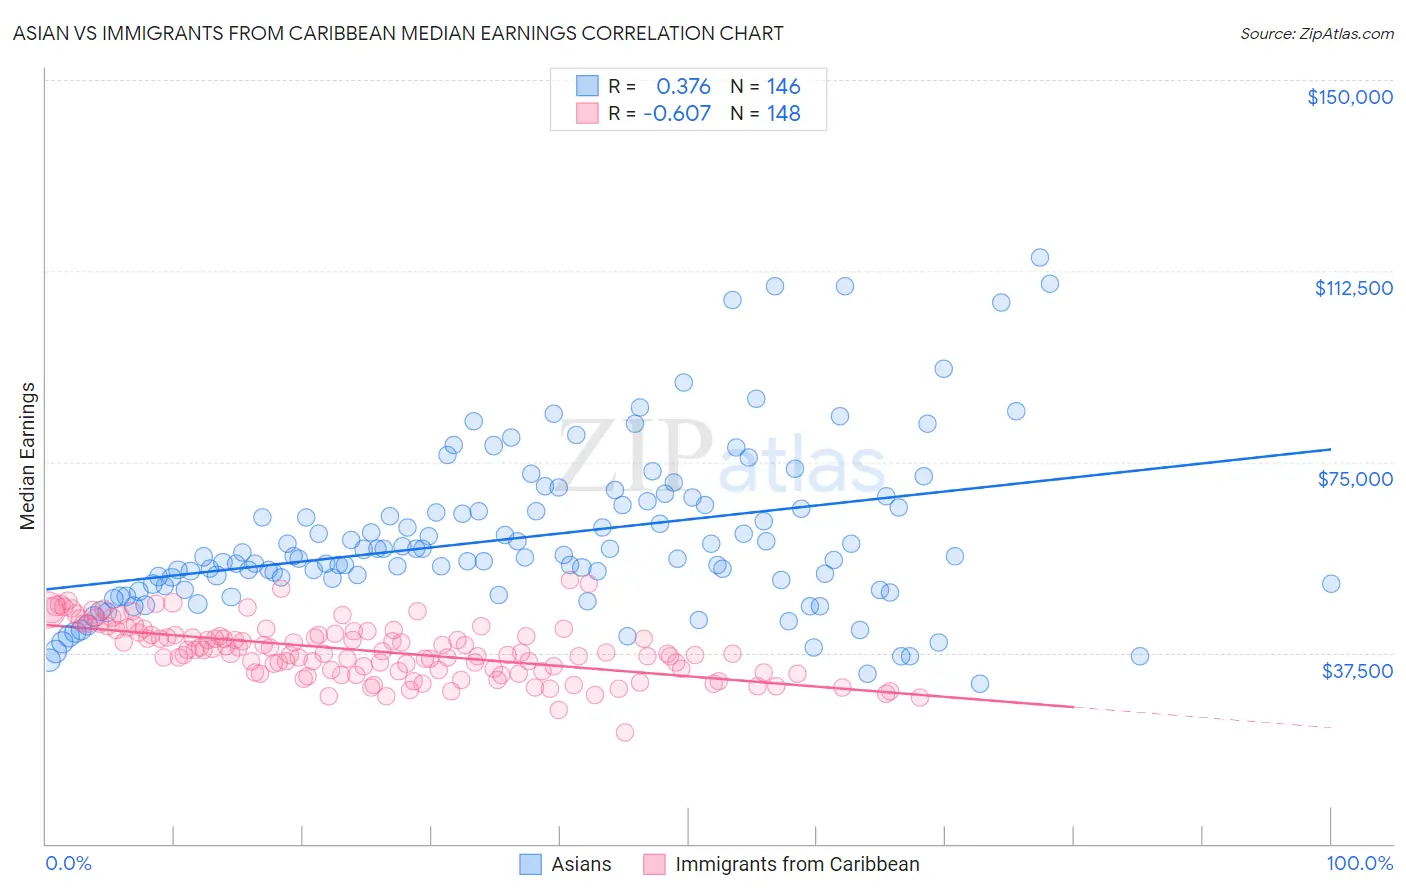
Asian vs Immigrants from Caribbean Median Earnings Correlation Chart
The statistical analysis conducted on geographies consisting of 550,727,448 people shows a mild positive correlation between the proportion of Asians and median earnings in the United States with a correlation coefficient (R) of 0.376 and weighted average of $53,690. Similarly, the statistical analysis conducted on geographies consisting of 450,013,484 people shows a significant negative correlation between the proportion of Immigrants from Caribbean and median earnings in the United States with a correlation coefficient (R) of -0.607 and weighted average of $41,119, a difference of 30.6%.
Median Earnings Correlation Summary
| Measurement | Asian | Immigrants from Caribbean |
| Minimum | $31,416 | $21,741 |
| Maximum | $115,028 | $51,911 |
| Range | $83,612 | $30,170 |
| Mean | $60,136 | $37,958 |
| Median | $56,241 | $37,629 |
| Interquartile 25% (IQ1) | $50,602 | $33,921 |
| Interquartile 75% (IQ3) | $66,425 | $41,541 |
| Interquartile Range (IQR) | $15,823 | $7,620 |
| Standard Deviation (Sample) | $16,173 | $5,439 |
| Standard Deviation (Population) | $16,117 | $5,421 |
Similar Demographics by Median Earnings
Demographics Similar to Asians by Median Earnings
In terms of median earnings, the demographic groups most similar to Asians are Immigrants from Northern Europe ($53,872, a difference of 0.34%), Immigrants from France ($53,490, a difference of 0.37%), Turkish ($53,919, a difference of 0.43%), Immigrants from Russia ($53,457, a difference of 0.43%), and Cambodian ($53,386, a difference of 0.57%).
| Demographics | Rating | Rank | Median Earnings |
| Cypriots | 100.0 /100 | #20 | Exceptional $54,589 |
| Burmese | 100.0 /100 | #21 | Exceptional $54,559 |
| Immigrants | Korea | 100.0 /100 | #22 | Exceptional $54,530 |
| Immigrants | Sweden | 100.0 /100 | #23 | Exceptional $54,478 |
| Soviet Union | 100.0 /100 | #24 | Exceptional $54,290 |
| Turks | 100.0 /100 | #25 | Exceptional $53,919 |
| Immigrants | Northern Europe | 100.0 /100 | #26 | Exceptional $53,872 |
| Asians | 100.0 /100 | #27 | Exceptional $53,690 |
| Immigrants | France | 100.0 /100 | #28 | Exceptional $53,490 |
| Immigrants | Russia | 100.0 /100 | #29 | Exceptional $53,457 |
| Cambodians | 100.0 /100 | #30 | Exceptional $53,386 |
| Russians | 100.0 /100 | #31 | Exceptional $53,334 |
| Immigrants | Asia | 100.0 /100 | #32 | Exceptional $53,310 |
| Immigrants | Greece | 100.0 /100 | #33 | Exceptional $53,282 |
| Immigrants | Sri Lanka | 100.0 /100 | #34 | Exceptional $53,268 |
Demographics Similar to Immigrants from Caribbean by Median Earnings
In terms of median earnings, the demographic groups most similar to Immigrants from Caribbean are Immigrants from Micronesia ($41,133, a difference of 0.030%), Ute ($41,051, a difference of 0.17%), Immigrants from Latin America ($41,049, a difference of 0.17%), Guatemalan ($41,205, a difference of 0.21%), and Cherokee ($41,252, a difference of 0.32%).
| Demographics | Rating | Rank | Median Earnings |
| U.S. Virgin Islanders | 0.1 /100 | #292 | Tragic $41,448 |
| Immigrants | Zaire | 0.1 /100 | #293 | Tragic $41,325 |
| Potawatomi | 0.1 /100 | #294 | Tragic $41,288 |
| Bangladeshis | 0.1 /100 | #295 | Tragic $41,263 |
| Cherokee | 0.1 /100 | #296 | Tragic $41,252 |
| Guatemalans | 0.1 /100 | #297 | Tragic $41,205 |
| Immigrants | Micronesia | 0.1 /100 | #298 | Tragic $41,133 |
| Immigrants | Caribbean | 0.1 /100 | #299 | Tragic $41,119 |
| Ute | 0.1 /100 | #300 | Tragic $41,051 |
| Immigrants | Latin America | 0.1 /100 | #301 | Tragic $41,049 |
| Shoshone | 0.0 /100 | #302 | Tragic $40,932 |
| Haitians | 0.0 /100 | #303 | Tragic $40,918 |
| Immigrants | Guatemala | 0.0 /100 | #304 | Tragic $40,851 |
| Chickasaw | 0.0 /100 | #305 | Tragic $40,672 |
| Yaqui | 0.0 /100 | #306 | Tragic $40,647 |