Slovak vs Immigrants from Belarus Median Household Income
COMPARE
Slovak
Immigrants from Belarus
Median Household Income
Median Household Income Comparison
Slovaks
Immigrants from Belarus
$83,798
MEDIAN HOUSEHOLD INCOME
30.2/ 100
METRIC RATING
190th/ 347
METRIC RANK
$94,399
MEDIAN HOUSEHOLD INCOME
99.7/ 100
METRIC RATING
65th/ 347
METRIC RANK
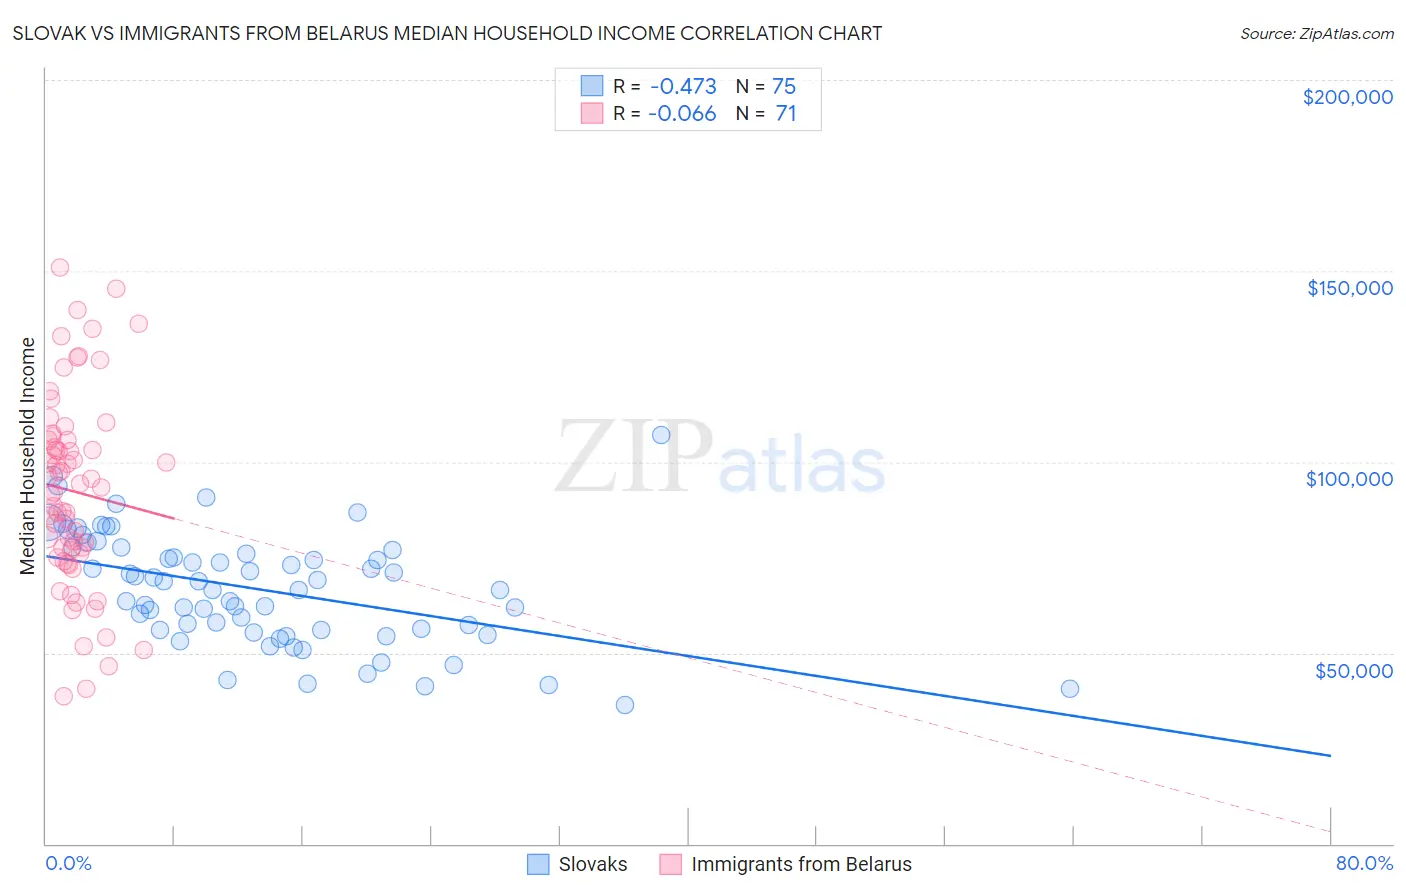
Slovak vs Immigrants from Belarus Median Household Income Correlation Chart
The statistical analysis conducted on geographies consisting of 397,588,666 people shows a moderate negative correlation between the proportion of Slovaks and median household income in the United States with a correlation coefficient (R) of -0.473 and weighted average of $83,798. Similarly, the statistical analysis conducted on geographies consisting of 150,184,095 people shows a slight negative correlation between the proportion of Immigrants from Belarus and median household income in the United States with a correlation coefficient (R) of -0.066 and weighted average of $94,399, a difference of 12.7%.
Median Household Income Correlation Summary
| Measurement | Slovak | Immigrants from Belarus |
| Minimum | $36,453 | $38,670 |
| Maximum | $106,990 | $150,801 |
| Range | $70,537 | $112,131 |
| Mean | $66,640 | $92,306 |
| Median | $66,359 | $93,264 |
| Interquartile 25% (IQ1) | $55,938 | $75,784 |
| Interquartile 75% (IQ3) | $76,771 | $105,707 |
| Interquartile Range (IQR) | $20,833 | $29,923 |
| Standard Deviation (Sample) | $14,677 | $25,053 |
| Standard Deviation (Population) | $14,579 | $24,876 |
Similar Demographics by Median Household Income
Demographics Similar to Slovaks by Median Household Income
In terms of median household income, the demographic groups most similar to Slovaks are Iraqi ($83,753, a difference of 0.050%), Immigrants from Colombia ($83,902, a difference of 0.12%), Tlingit-Haida ($83,968, a difference of 0.20%), Welsh ($83,628, a difference of 0.20%), and Finnish ($83,607, a difference of 0.23%).
| Demographics | Rating | Rank | Median Household Income |
| Spaniards | 42.7 /100 | #183 | Average $84,644 |
| Immigrants | Eastern Africa | 37.4 /100 | #184 | Fair $84,299 |
| Kenyans | 34.2 /100 | #185 | Fair $84,085 |
| Puget Sound Salish | 33.2 /100 | #186 | Fair $84,011 |
| Belgians | 33.2 /100 | #187 | Fair $84,008 |
| Tlingit-Haida | 32.6 /100 | #188 | Fair $83,968 |
| Immigrants | Colombia | 31.7 /100 | #189 | Fair $83,902 |
| Slovaks | 30.2 /100 | #190 | Fair $83,798 |
| Iraqis | 29.6 /100 | #191 | Fair $83,753 |
| Welsh | 28.0 /100 | #192 | Fair $83,628 |
| Finns | 27.7 /100 | #193 | Fair $83,607 |
| Ghanaians | 27.4 /100 | #194 | Fair $83,582 |
| Immigrants | Armenia | 27.0 /100 | #195 | Fair $83,555 |
| French | 26.0 /100 | #196 | Fair $83,468 |
| Aleuts | 25.7 /100 | #197 | Fair $83,446 |
Demographics Similar to Immigrants from Belarus by Median Household Income
In terms of median household income, the demographic groups most similar to Immigrants from Belarus are Immigrants from Netherlands ($94,411, a difference of 0.010%), Immigrants from Romania ($94,222, a difference of 0.19%), Immigrants from Scotland ($94,091, a difference of 0.33%), Greek ($94,735, a difference of 0.36%), and Mongolian ($93,971, a difference of 0.46%).
| Demographics | Rating | Rank | Median Household Income |
| Soviet Union | 99.8 /100 | #58 | Exceptional $95,098 |
| Immigrants | Europe | 99.8 /100 | #59 | Exceptional $95,032 |
| Koreans | 99.8 /100 | #60 | Exceptional $95,018 |
| Laotians | 99.8 /100 | #61 | Exceptional $94,990 |
| Immigrants | Norway | 99.8 /100 | #62 | Exceptional $94,846 |
| Greeks | 99.8 /100 | #63 | Exceptional $94,735 |
| Immigrants | Netherlands | 99.7 /100 | #64 | Exceptional $94,411 |
| Immigrants | Belarus | 99.7 /100 | #65 | Exceptional $94,399 |
| Immigrants | Romania | 99.7 /100 | #66 | Exceptional $94,222 |
| Immigrants | Scotland | 99.7 /100 | #67 | Exceptional $94,091 |
| Mongolians | 99.7 /100 | #68 | Exceptional $93,971 |
| Argentineans | 99.7 /100 | #69 | Exceptional $93,960 |
| Immigrants | Fiji | 99.7 /100 | #70 | Exceptional $93,933 |
| Immigrants | Philippines | 99.6 /100 | #71 | Exceptional $93,899 |
| Lithuanians | 99.6 /100 | #72 | Exceptional $93,852 |