Asian vs Immigrants from Belarus Family Households
COMPARE
Asian
Immigrants from Belarus
Family Households
Family Households Comparison
Asians
Immigrants from Belarus
66.5%
FAMILY HOUSEHOLDS
100.0/ 100
METRIC RATING
44th/ 347
METRIC RANK
63.7%
FAMILY HOUSEHOLDS
5.5/ 100
METRIC RATING
222nd/ 347
METRIC RANK
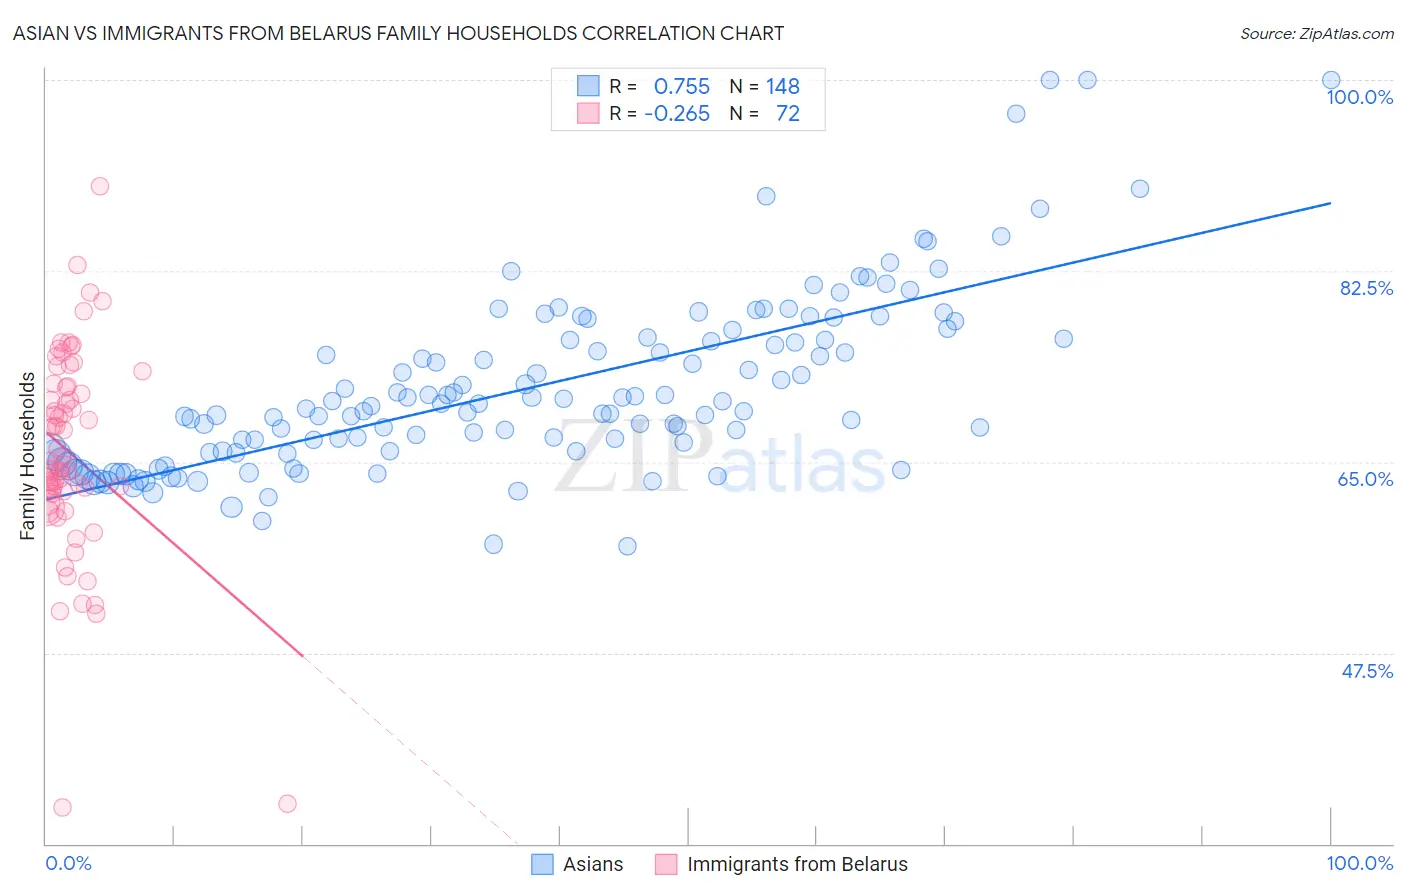
Asian vs Immigrants from Belarus Family Households Correlation Chart
The statistical analysis conducted on geographies consisting of 550,272,164 people shows a strong positive correlation between the proportion of Asians and percentage of family households in the United States with a correlation coefficient (R) of 0.755 and weighted average of 66.5%. Similarly, the statistical analysis conducted on geographies consisting of 150,177,512 people shows a weak negative correlation between the proportion of Immigrants from Belarus and percentage of family households in the United States with a correlation coefficient (R) of -0.265 and weighted average of 63.7%, a difference of 4.4%.
Family Households Correlation Summary
| Measurement | Asian | Immigrants from Belarus |
| Minimum | 57.2% | 33.4% |
| Maximum | 100.0% | 90.2% |
| Range | 42.8% | 56.9% |
| Mean | 71.8% | 65.8% |
| Median | 70.0% | 64.9% |
| Interquartile 25% (IQ1) | 65.9% | 62.2% |
| Interquartile 75% (IQ3) | 76.2% | 71.9% |
| Interquartile Range (IQR) | 10.4% | 9.7% |
| Standard Deviation (Sample) | 8.1% | 9.5% |
| Standard Deviation (Population) | 8.1% | 9.4% |
Similar Demographics by Family Households
Demographics Similar to Asians by Family Households
In terms of family households, the demographic groups most similar to Asians are Venezuelan (66.5%, a difference of 0.020%), Apache (66.5%, a difference of 0.050%), Arapaho (66.5%, a difference of 0.050%), Menominee (66.5%, a difference of 0.060%), and Bolivian (66.5%, a difference of 0.070%).
| Demographics | Rating | Rank | Family Households |
| Tsimshian | 100.0 /100 | #37 | Exceptional 67.1% |
| Mexican American Indians | 100.0 /100 | #38 | Exceptional 67.0% |
| Immigrants | El Salvador | 100.0 /100 | #39 | Exceptional 67.0% |
| Guamanians/Chamorros | 100.0 /100 | #40 | Exceptional 66.6% |
| Immigrants | Bolivia | 100.0 /100 | #41 | Exceptional 66.6% |
| Menominee | 100.0 /100 | #42 | Exceptional 66.5% |
| Apache | 100.0 /100 | #43 | Exceptional 66.5% |
| Asians | 100.0 /100 | #44 | Exceptional 66.5% |
| Venezuelans | 100.0 /100 | #45 | Exceptional 66.5% |
| Arapaho | 100.0 /100 | #46 | Exceptional 66.5% |
| Bolivians | 100.0 /100 | #47 | Exceptional 66.5% |
| Immigrants | Venezuela | 100.0 /100 | #48 | Exceptional 66.4% |
| Immigrants | South Central Asia | 100.0 /100 | #49 | Exceptional 66.4% |
| Navajo | 100.0 /100 | #50 | Exceptional 66.4% |
| Natives/Alaskans | 100.0 /100 | #51 | Exceptional 66.4% |
Demographics Similar to Immigrants from Belarus by Family Households
In terms of family households, the demographic groups most similar to Immigrants from Belarus are French Canadian (63.7%, a difference of 0.010%), Immigrants from South Africa (63.7%, a difference of 0.030%), Immigrants from Europe (63.7%, a difference of 0.050%), Macedonian (63.7%, a difference of 0.060%), and Turkish (63.6%, a difference of 0.070%).
| Demographics | Rating | Rank | Family Households |
| Belgians | 7.6 /100 | #215 | Tragic 63.8% |
| Croatians | 7.3 /100 | #216 | Tragic 63.8% |
| Osage | 7.0 /100 | #217 | Tragic 63.7% |
| Marshallese | 6.9 /100 | #218 | Tragic 63.7% |
| Macedonians | 6.5 /100 | #219 | Tragic 63.7% |
| Immigrants | Europe | 6.4 /100 | #220 | Tragic 63.7% |
| Immigrants | South Africa | 5.9 /100 | #221 | Tragic 63.7% |
| Immigrants | Belarus | 5.5 /100 | #222 | Tragic 63.7% |
| French Canadians | 5.4 /100 | #223 | Tragic 63.7% |
| Turks | 4.5 /100 | #224 | Tragic 63.6% |
| Immigrants | Hungary | 4.3 /100 | #225 | Tragic 63.6% |
| Immigrants | Bahamas | 4.2 /100 | #226 | Tragic 63.6% |
| Trinidadians and Tobagonians | 4.1 /100 | #227 | Tragic 63.6% |
| Blackfeet | 3.6 /100 | #228 | Tragic 63.6% |
| Bulgarians | 3.4 /100 | #229 | Tragic 63.6% |