Arapaho vs Israeli Median Female Earnings
COMPARE
Arapaho
Israeli
Median Female Earnings
Median Female Earnings Comparison
Arapaho
Israelis
$31,489
MEDIAN FEMALE EARNINGS
0.0/ 100
METRIC RATING
346th/ 347
METRIC RANK
$43,852
MEDIAN FEMALE EARNINGS
100.0/ 100
METRIC RATING
39th/ 347
METRIC RANK
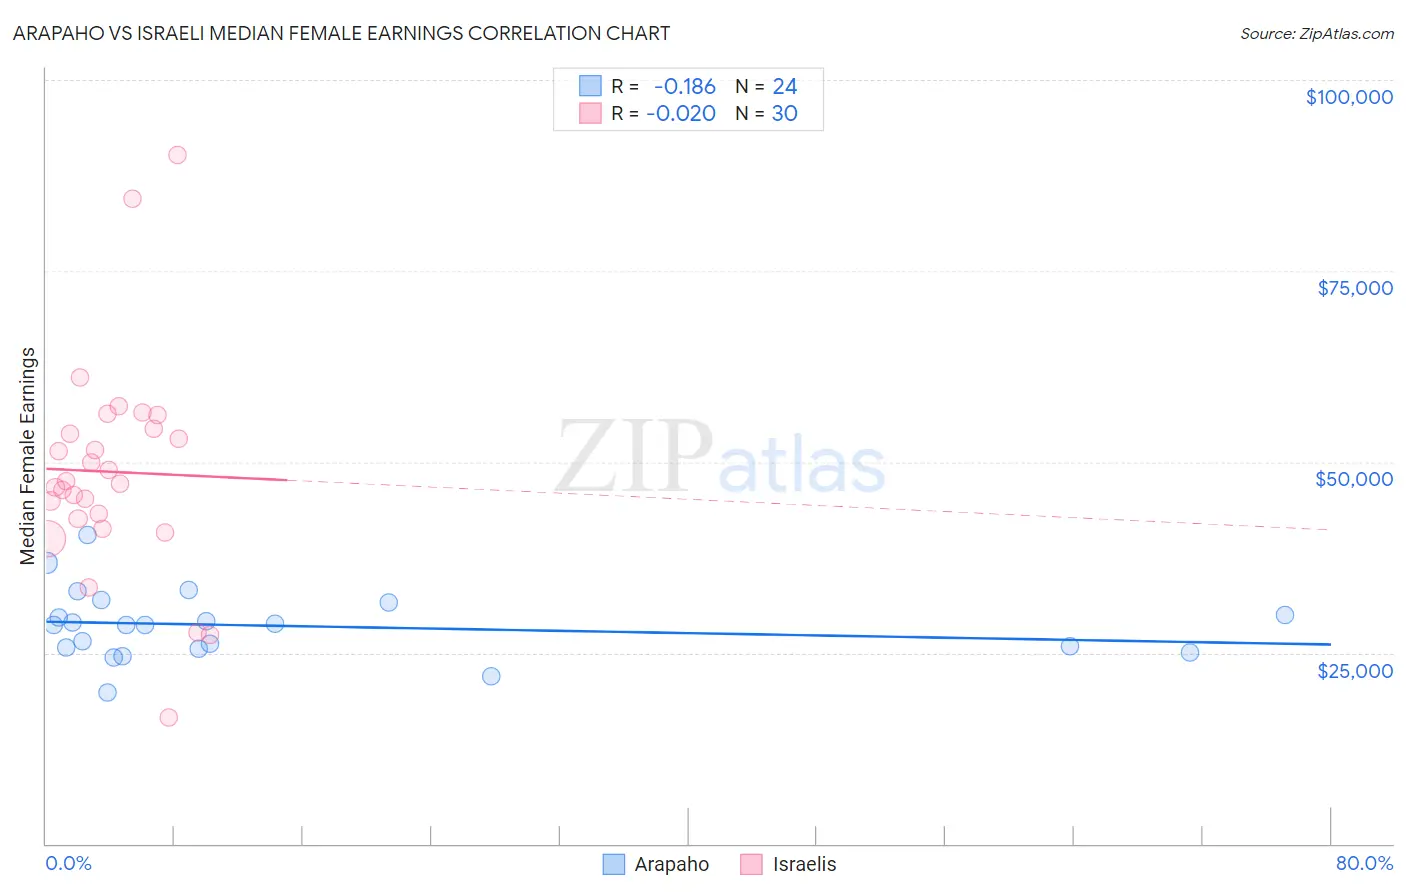
Arapaho vs Israeli Median Female Earnings Correlation Chart
The statistical analysis conducted on geographies consisting of 29,776,290 people shows a poor negative correlation between the proportion of Arapaho and median female earnings in the United States with a correlation coefficient (R) of -0.186 and weighted average of $31,489. Similarly, the statistical analysis conducted on geographies consisting of 211,198,030 people shows no correlation between the proportion of Israelis and median female earnings in the United States with a correlation coefficient (R) of -0.020 and weighted average of $43,852, a difference of 39.3%.
Median Female Earnings Correlation Summary
| Measurement | Arapaho | Israeli |
| Minimum | $19,750 | $16,513 |
| Maximum | $40,452 | $90,109 |
| Range | $20,702 | $73,596 |
| Mean | $28,528 | $48,703 |
| Median | $28,660 | $47,323 |
| Interquartile 25% (IQ1) | $25,558 | $42,485 |
| Interquartile 75% (IQ3) | $30,782 | $54,278 |
| Interquartile Range (IQR) | $5,224 | $11,793 |
| Standard Deviation (Sample) | $4,555 | $14,338 |
| Standard Deviation (Population) | $4,459 | $14,097 |
Similar Demographics by Median Female Earnings
Demographics Similar to Arapaho by Median Female Earnings
In terms of median female earnings, the demographic groups most similar to Arapaho are Puerto Rican ($31,560, a difference of 0.23%), Lumbee ($32,500, a difference of 3.2%), Pueblo ($32,564, a difference of 3.4%), Houma ($30,343, a difference of 3.8%), and Yup'ik ($32,730, a difference of 3.9%).
| Demographics | Rating | Rank | Median Female Earnings |
| Mexicans | 0.0 /100 | #333 | Tragic $33,664 |
| Spanish American Indians | 0.0 /100 | #334 | Tragic $33,625 |
| Creek | 0.0 /100 | #335 | Tragic $33,437 |
| Ottawa | 0.0 /100 | #336 | Tragic $33,378 |
| Yakama | 0.0 /100 | #337 | Tragic $33,354 |
| Immigrants | Cuba | 0.0 /100 | #338 | Tragic $33,291 |
| Immigrants | Mexico | 0.0 /100 | #339 | Tragic $33,236 |
| Tohono O'odham | 0.0 /100 | #340 | Tragic $33,205 |
| Navajo | 0.0 /100 | #341 | Tragic $33,046 |
| Yup'ik | 0.0 /100 | #342 | Tragic $32,730 |
| Pueblo | 0.0 /100 | #343 | Tragic $32,564 |
| Lumbee | 0.0 /100 | #344 | Tragic $32,500 |
| Puerto Ricans | 0.0 /100 | #345 | Tragic $31,560 |
| Arapaho | 0.0 /100 | #346 | Tragic $31,489 |
| Houma | 0.0 /100 | #347 | Tragic $30,343 |
Demographics Similar to Israelis by Median Female Earnings
In terms of median female earnings, the demographic groups most similar to Israelis are Immigrants from Malaysia ($43,835, a difference of 0.040%), Latvian ($43,941, a difference of 0.20%), Immigrants from Switzerland ($43,996, a difference of 0.33%), Bhutanese ($43,648, a difference of 0.47%), and Immigrants from Denmark ($43,646, a difference of 0.47%).
| Demographics | Rating | Rank | Median Female Earnings |
| Immigrants | Northern Europe | 100.0 /100 | #32 | Exceptional $44,366 |
| Immigrants | Asia | 100.0 /100 | #33 | Exceptional $44,198 |
| Russians | 100.0 /100 | #34 | Exceptional $44,169 |
| Immigrants | Sri Lanka | 100.0 /100 | #35 | Exceptional $44,161 |
| Immigrants | Turkey | 100.0 /100 | #36 | Exceptional $44,066 |
| Immigrants | Switzerland | 100.0 /100 | #37 | Exceptional $43,996 |
| Latvians | 100.0 /100 | #38 | Exceptional $43,941 |
| Israelis | 100.0 /100 | #39 | Exceptional $43,852 |
| Immigrants | Malaysia | 100.0 /100 | #40 | Exceptional $43,835 |
| Bhutanese | 100.0 /100 | #41 | Exceptional $43,648 |
| Immigrants | Denmark | 100.0 /100 | #42 | Exceptional $43,646 |
| Bulgarians | 100.0 /100 | #43 | Exceptional $43,638 |
| Immigrants | Czechoslovakia | 100.0 /100 | #44 | Exceptional $43,571 |
| Immigrants | Europe | 100.0 /100 | #45 | Exceptional $43,523 |
| Immigrants | Bolivia | 100.0 /100 | #46 | Exceptional $43,467 |