Bermudan vs Zimbabwean Median Female Earnings
COMPARE
Bermudan
Zimbabwean
Median Female Earnings
Median Female Earnings Comparison
Bermudans
Zimbabweans
$39,418
MEDIAN FEMALE EARNINGS
35.9/ 100
METRIC RATING
188th/ 347
METRIC RANK
$40,798
MEDIAN FEMALE EARNINGS
90.8/ 100
METRIC RATING
129th/ 347
METRIC RANK
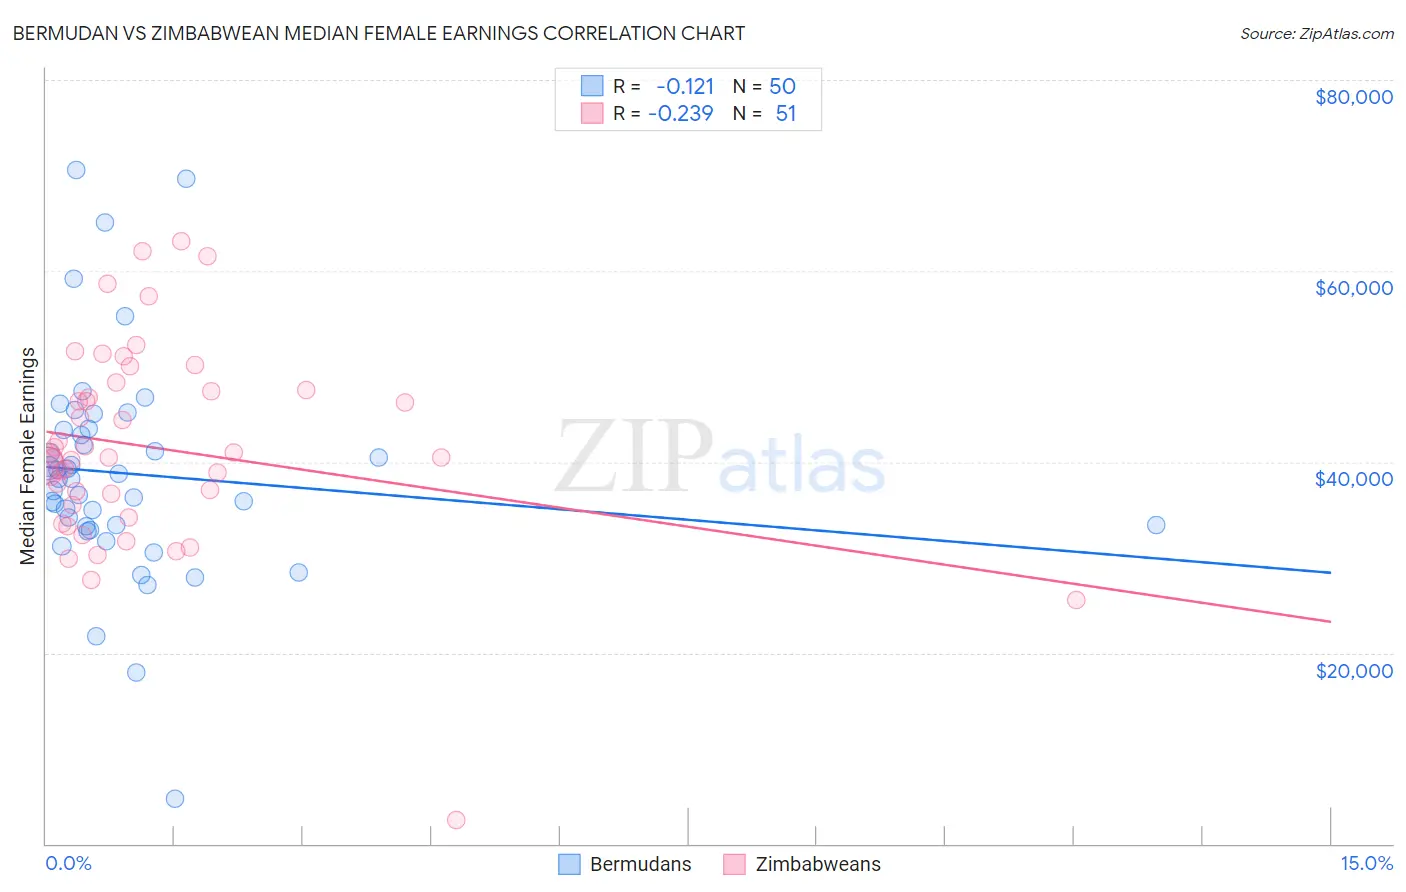
Bermudan vs Zimbabwean Median Female Earnings Correlation Chart
The statistical analysis conducted on geographies consisting of 55,724,642 people shows a poor negative correlation between the proportion of Bermudans and median female earnings in the United States with a correlation coefficient (R) of -0.121 and weighted average of $39,418. Similarly, the statistical analysis conducted on geographies consisting of 69,205,831 people shows a weak negative correlation between the proportion of Zimbabweans and median female earnings in the United States with a correlation coefficient (R) of -0.239 and weighted average of $40,798, a difference of 3.5%.
Median Female Earnings Correlation Summary
| Measurement | Bermudan | Zimbabwean |
| Minimum | $4,682 | $2,499 |
| Maximum | $70,590 | $63,108 |
| Range | $65,908 | $60,609 |
| Mean | $38,764 | $41,512 |
| Median | $38,256 | $40,486 |
| Interquartile 25% (IQ1) | $33,240 | $35,420 |
| Interquartile 75% (IQ3) | $43,282 | $47,538 |
| Interquartile Range (IQR) | $10,042 | $12,118 |
| Standard Deviation (Sample) | $11,556 | $10,575 |
| Standard Deviation (Population) | $11,440 | $10,471 |
Similar Demographics by Median Female Earnings
Demographics Similar to Bermudans by Median Female Earnings
In terms of median female earnings, the demographic groups most similar to Bermudans are Swedish ($39,421, a difference of 0.010%), Colombian ($39,439, a difference of 0.050%), Immigrants from West Indies ($39,441, a difference of 0.060%), Senegalese ($39,384, a difference of 0.090%), and European ($39,457, a difference of 0.10%).
| Demographics | Rating | Rank | Median Female Earnings |
| Tsimshian | 41.4 /100 | #181 | Average $39,530 |
| Tlingit-Haida | 40.5 /100 | #182 | Average $39,513 |
| Hungarians | 40.3 /100 | #183 | Average $39,510 |
| Europeans | 37.7 /100 | #184 | Fair $39,457 |
| Immigrants | West Indies | 36.9 /100 | #185 | Fair $39,441 |
| Colombians | 36.9 /100 | #186 | Fair $39,439 |
| Swedes | 36.0 /100 | #187 | Fair $39,421 |
| Bermudans | 35.9 /100 | #188 | Fair $39,418 |
| Senegalese | 34.2 /100 | #189 | Fair $39,384 |
| Puget Sound Salish | 33.9 /100 | #190 | Fair $39,376 |
| Immigrants | Western Africa | 32.7 /100 | #191 | Fair $39,351 |
| Immigrants | Immigrants | 31.7 /100 | #192 | Fair $39,328 |
| Immigrants | Nigeria | 30.2 /100 | #193 | Fair $39,294 |
| Irish | 30.0 /100 | #194 | Fair $39,291 |
| Uruguayans | 27.3 /100 | #195 | Fair $39,228 |
Demographics Similar to Zimbabweans by Median Female Earnings
In terms of median female earnings, the demographic groups most similar to Zimbabweans are Immigrants from Guyana ($40,773, a difference of 0.060%), Carpatho Rusyn ($40,825, a difference of 0.070%), Chilean ($40,757, a difference of 0.10%), Immigrants from Uganda ($40,739, a difference of 0.14%), and Syrian ($40,727, a difference of 0.17%).
| Demographics | Rating | Rank | Median Female Earnings |
| Immigrants | Jordan | 93.5 /100 | #122 | Exceptional $40,977 |
| Guyanese | 93.4 /100 | #123 | Exceptional $40,973 |
| Trinidadians and Tobagonians | 93.2 /100 | #124 | Exceptional $40,958 |
| Austrians | 92.7 /100 | #125 | Exceptional $40,923 |
| Immigrants | Trinidad and Tobago | 92.3 /100 | #126 | Exceptional $40,895 |
| Ugandans | 92.2 /100 | #127 | Exceptional $40,889 |
| Carpatho Rusyns | 91.2 /100 | #128 | Exceptional $40,825 |
| Zimbabweans | 90.8 /100 | #129 | Exceptional $40,798 |
| Immigrants | Guyana | 90.3 /100 | #130 | Exceptional $40,773 |
| Chileans | 90.0 /100 | #131 | Exceptional $40,757 |
| Immigrants | Uganda | 89.7 /100 | #132 | Excellent $40,739 |
| Syrians | 89.5 /100 | #133 | Excellent $40,727 |
| Arabs | 89.3 /100 | #134 | Excellent $40,718 |
| Immigrants | Nepal | 89.0 /100 | #135 | Excellent $40,704 |
| Immigrants | Eastern Africa | 87.7 /100 | #136 | Excellent $40,644 |