Immigrants from Northern Africa vs U.S. Virgin Islander Median Household Income
COMPARE
Immigrants from Northern Africa
U.S. Virgin Islander
Median Household Income
Median Household Income Comparison
Immigrants from Northern Africa
U.S. Virgin Islanders
$90,026
MEDIAN HOUSEHOLD INCOME
95.9/ 100
METRIC RATING
114th/ 347
METRIC RANK
$71,853
MEDIAN HOUSEHOLD INCOME
0.0/ 100
METRIC RATING
310th/ 347
METRIC RANK
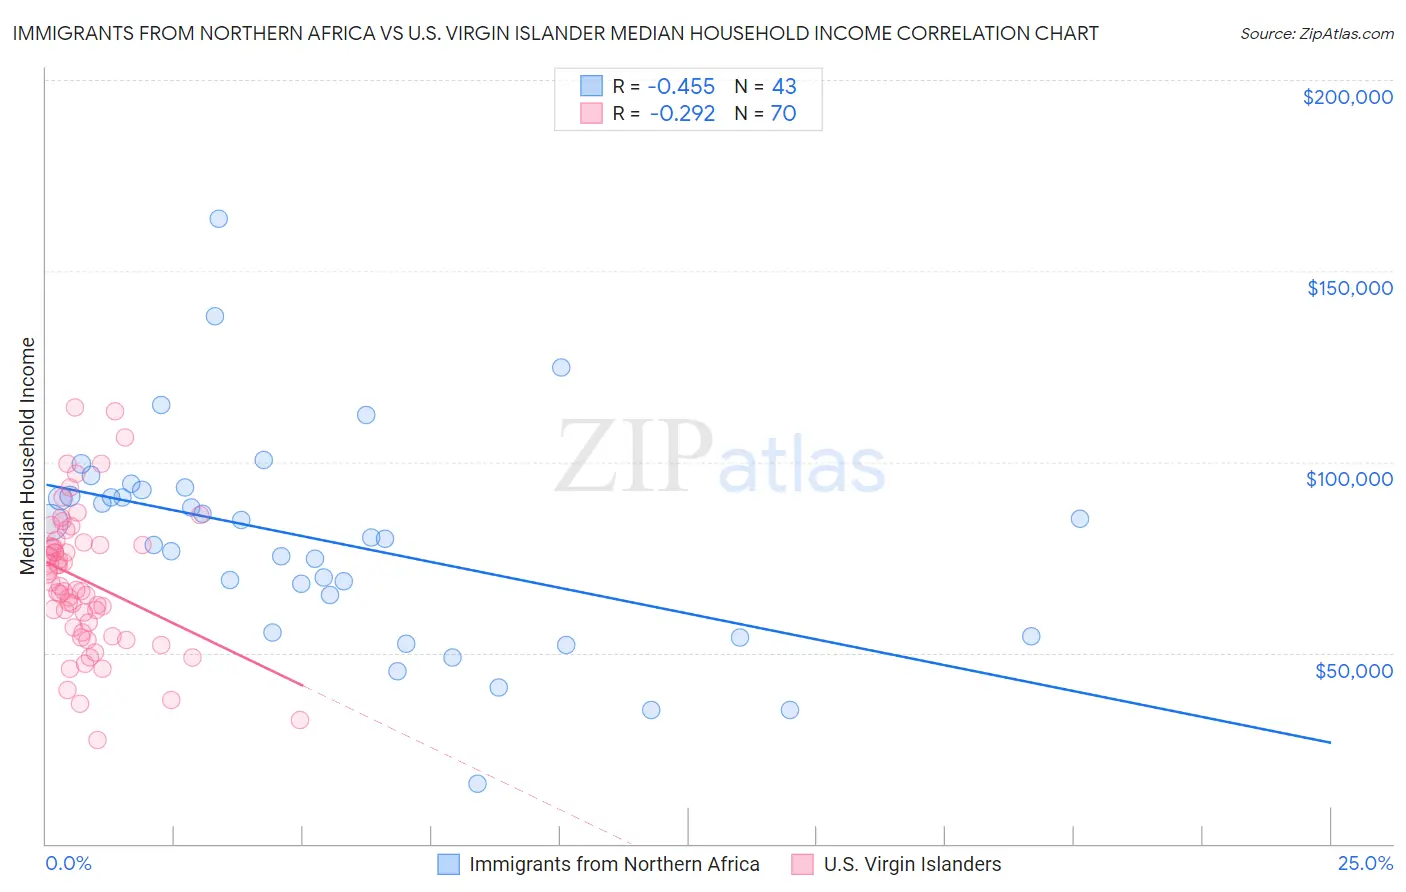
Immigrants from Northern Africa vs U.S. Virgin Islander Median Household Income Correlation Chart
The statistical analysis conducted on geographies consisting of 321,059,386 people shows a moderate negative correlation between the proportion of Immigrants from Northern Africa and median household income in the United States with a correlation coefficient (R) of -0.455 and weighted average of $90,026. Similarly, the statistical analysis conducted on geographies consisting of 87,500,449 people shows a weak negative correlation between the proportion of U.S. Virgin Islanders and median household income in the United States with a correlation coefficient (R) of -0.292 and weighted average of $71,853, a difference of 25.3%.
Median Household Income Correlation Summary
| Measurement | Immigrants from Northern Africa | U.S. Virgin Islander |
| Minimum | $15,682 | $27,212 |
| Maximum | $163,611 | $114,181 |
| Range | $147,929 | $86,969 |
| Mean | $79,183 | $69,001 |
| Median | $80,044 | $68,056 |
| Interquartile 25% (IQ1) | $55,170 | $56,650 |
| Interquartile 75% (IQ3) | $92,628 | $78,391 |
| Interquartile Range (IQR) | $37,458 | $21,741 |
| Standard Deviation (Sample) | $28,084 | $18,092 |
| Standard Deviation (Population) | $27,755 | $17,962 |
Similar Demographics by Median Household Income
Demographics Similar to Immigrants from Northern Africa by Median Household Income
In terms of median household income, the demographic groups most similar to Immigrants from Northern Africa are Immigrants from Western Asia ($90,005, a difference of 0.020%), Native Hawaiian ($89,919, a difference of 0.12%), Taiwanese ($89,900, a difference of 0.14%), Syrian ($89,830, a difference of 0.22%), and Peruvian ($90,261, a difference of 0.26%).
| Demographics | Rating | Rank | Median Household Income |
| Croatians | 97.3 /100 | #107 | Exceptional $90,685 |
| Zimbabweans | 97.2 /100 | #108 | Exceptional $90,618 |
| Chileans | 97.2 /100 | #109 | Exceptional $90,605 |
| Palestinians | 97.1 /100 | #110 | Exceptional $90,574 |
| Immigrants | Poland | 97.1 /100 | #111 | Exceptional $90,549 |
| Northern Europeans | 96.9 /100 | #112 | Exceptional $90,446 |
| Peruvians | 96.5 /100 | #113 | Exceptional $90,261 |
| Immigrants | Northern Africa | 95.9 /100 | #114 | Exceptional $90,026 |
| Immigrants | Western Asia | 95.9 /100 | #115 | Exceptional $90,005 |
| Native Hawaiians | 95.7 /100 | #116 | Exceptional $89,919 |
| Taiwanese | 95.6 /100 | #117 | Exceptional $89,900 |
| Syrians | 95.4 /100 | #118 | Exceptional $89,830 |
| Albanians | 95.2 /100 | #119 | Exceptional $89,744 |
| Immigrants | North Macedonia | 95.2 /100 | #120 | Exceptional $89,741 |
| Ethiopians | 94.9 /100 | #121 | Exceptional $89,640 |
Demographics Similar to U.S. Virgin Islanders by Median Household Income
In terms of median household income, the demographic groups most similar to U.S. Virgin Islanders are Immigrants from Caribbean ($71,860, a difference of 0.010%), Immigrants from Zaire ($71,801, a difference of 0.070%), Yakama ($72,225, a difference of 0.52%), Immigrants from Honduras ($71,452, a difference of 0.56%), and Immigrants from Bahamas ($71,349, a difference of 0.71%).
| Demographics | Rating | Rank | Median Household Income |
| Africans | 0.0 /100 | #303 | Tragic $72,650 |
| Immigrants | Haiti | 0.0 /100 | #304 | Tragic $72,599 |
| Hondurans | 0.0 /100 | #305 | Tragic $72,588 |
| Potawatomi | 0.0 /100 | #306 | Tragic $72,576 |
| Ute | 0.0 /100 | #307 | Tragic $72,402 |
| Yakama | 0.0 /100 | #308 | Tragic $72,225 |
| Immigrants | Caribbean | 0.0 /100 | #309 | Tragic $71,860 |
| U.S. Virgin Islanders | 0.0 /100 | #310 | Tragic $71,853 |
| Immigrants | Zaire | 0.0 /100 | #311 | Tragic $71,801 |
| Immigrants | Honduras | 0.0 /100 | #312 | Tragic $71,452 |
| Immigrants | Bahamas | 0.0 /100 | #313 | Tragic $71,349 |
| Dominicans | 0.0 /100 | #314 | Tragic $71,302 |
| Ottawa | 0.0 /100 | #315 | Tragic $70,984 |
| Apache | 0.0 /100 | #316 | Tragic $70,927 |
| Cajuns | 0.0 /100 | #317 | Tragic $70,605 |