Apache vs U.S. Virgin Islander Vision Disability
COMPARE
Apache
U.S. Virgin Islander
Vision Disability
Vision Disability Comparison
Apache
U.S. Virgin Islanders
3.0%
VISION DISABILITY
0.0/ 100
METRIC RATING
329th/ 347
METRIC RANK
2.5%
VISION DISABILITY
0.0/ 100
METRIC RATING
281st/ 347
METRIC RANK
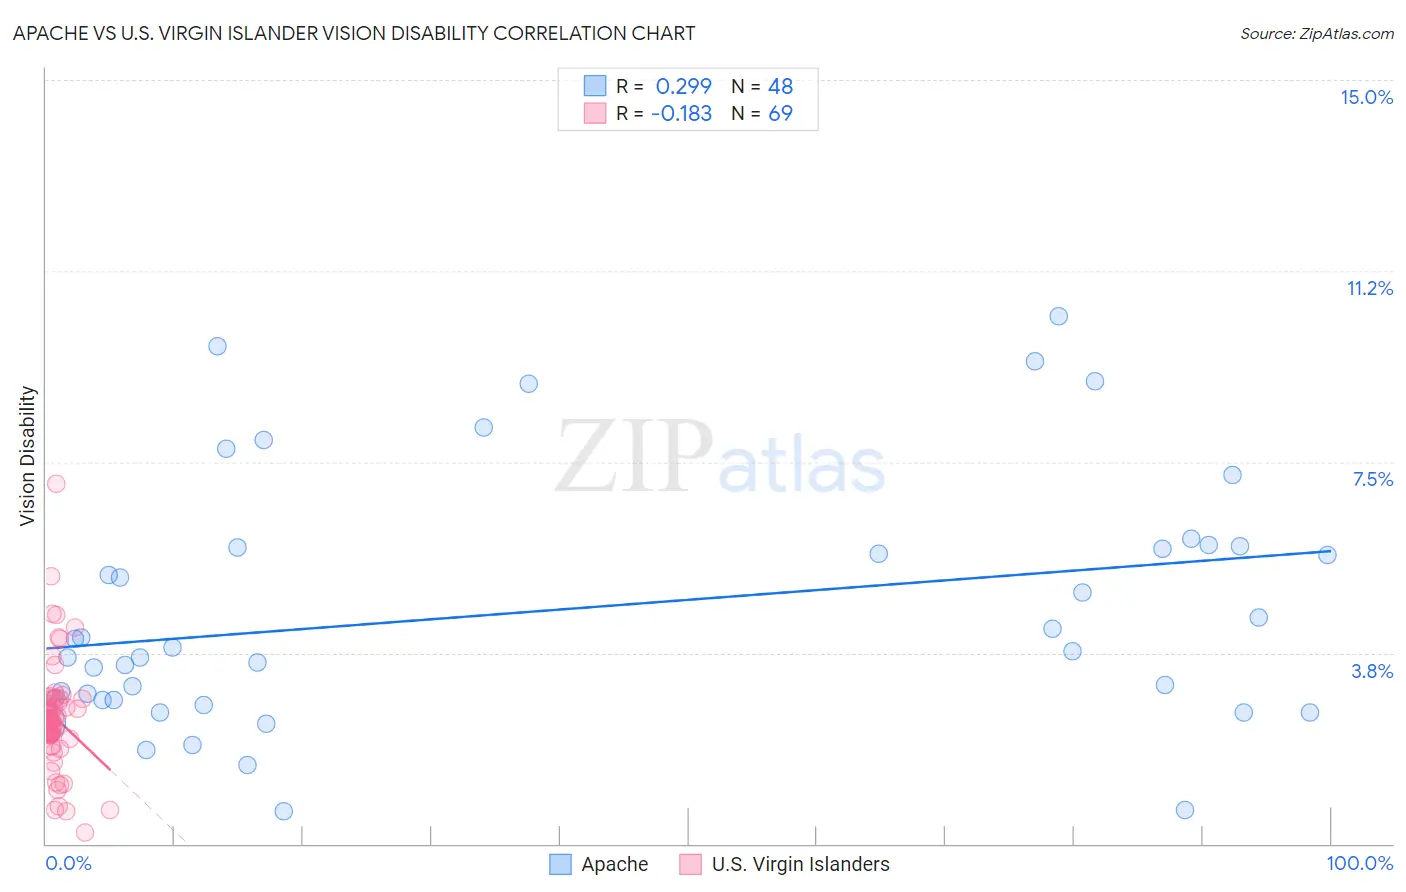
Apache vs U.S. Virgin Islander Vision Disability Correlation Chart
The statistical analysis conducted on geographies consisting of 231,003,425 people shows a weak positive correlation between the proportion of Apache and percentage of population with vision disability in the United States with a correlation coefficient (R) of 0.299 and weighted average of 3.0%. Similarly, the statistical analysis conducted on geographies consisting of 87,464,178 people shows a poor negative correlation between the proportion of U.S. Virgin Islanders and percentage of population with vision disability in the United States with a correlation coefficient (R) of -0.183 and weighted average of 2.5%, a difference of 22.0%.
Vision Disability Correlation Summary
| Measurement | Apache | U.S. Virgin Islander |
| Minimum | 0.65% | 0.21% |
| Maximum | 10.4% | 7.1% |
| Range | 9.7% | 6.8% |
| Mean | 4.6% | 2.5% |
| Median | 3.8% | 2.4% |
| Interquartile 25% (IQ1) | 2.8% | 2.1% |
| Interquartile 75% (IQ3) | 5.8% | 2.8% |
| Interquartile Range (IQR) | 3.0% | 0.67% |
| Standard Deviation (Sample) | 2.5% | 1.1% |
| Standard Deviation (Population) | 2.4% | 1.1% |
Similar Demographics by Vision Disability
Demographics Similar to Apache by Vision Disability
In terms of vision disability, the demographic groups most similar to Apache are Yuman (3.0%, a difference of 0.19%), Native/Alaskan (3.0%, a difference of 0.74%), Colville (3.0%, a difference of 1.2%), Spanish American (2.9%, a difference of 1.5%), and Central American Indian (3.0%, a difference of 1.8%).
| Demographics | Rating | Rank | Vision Disability |
| Paiute | 0.0 /100 | #322 | Tragic 2.9% |
| Tlingit-Haida | 0.0 /100 | #323 | Tragic 2.9% |
| Hopi | 0.0 /100 | #324 | Tragic 2.9% |
| Cherokee | 0.0 /100 | #325 | Tragic 2.9% |
| Spanish Americans | 0.0 /100 | #326 | Tragic 2.9% |
| Natives/Alaskans | 0.0 /100 | #327 | Tragic 3.0% |
| Yuman | 0.0 /100 | #328 | Tragic 3.0% |
| Apache | 0.0 /100 | #329 | Tragic 3.0% |
| Colville | 0.0 /100 | #330 | Tragic 3.0% |
| Central American Indians | 0.0 /100 | #331 | Tragic 3.0% |
| Seminole | 0.0 /100 | #332 | Tragic 3.1% |
| Cajuns | 0.0 /100 | #333 | Tragic 3.1% |
| Cheyenne | 0.0 /100 | #334 | Tragic 3.1% |
| Navajo | 0.0 /100 | #335 | Tragic 3.1% |
| Alaskan Athabascans | 0.0 /100 | #336 | Tragic 3.1% |
Demographics Similar to U.S. Virgin Islanders by Vision Disability
In terms of vision disability, the demographic groups most similar to U.S. Virgin Islanders are Immigrants from Caribbean (2.5%, a difference of 0.12%), Cape Verdean (2.4%, a difference of 0.23%), Puget Sound Salish (2.5%, a difference of 0.25%), Nepalese (2.4%, a difference of 0.27%), and Spanish (2.4%, a difference of 0.28%).
| Demographics | Rating | Rank | Vision Disability |
| Immigrants | Latin America | 0.0 /100 | #274 | Tragic 2.4% |
| Chippewa | 0.0 /100 | #275 | Tragic 2.4% |
| Scotch-Irish | 0.0 /100 | #276 | Tragic 2.4% |
| Bahamians | 0.0 /100 | #277 | Tragic 2.4% |
| Spanish | 0.0 /100 | #278 | Tragic 2.4% |
| Nepalese | 0.0 /100 | #279 | Tragic 2.4% |
| Cape Verdeans | 0.0 /100 | #280 | Tragic 2.4% |
| U.S. Virgin Islanders | 0.0 /100 | #281 | Tragic 2.5% |
| Immigrants | Caribbean | 0.0 /100 | #282 | Tragic 2.5% |
| Puget Sound Salish | 0.0 /100 | #283 | Tragic 2.5% |
| Yakama | 0.0 /100 | #284 | Tragic 2.5% |
| Immigrants | Central America | 0.0 /100 | #285 | Tragic 2.5% |
| Sioux | 0.0 /100 | #286 | Tragic 2.5% |
| Hondurans | 0.0 /100 | #287 | Tragic 2.5% |
| French American Indians | 0.0 /100 | #288 | Tragic 2.5% |