Brazilian vs U.S. Virgin Islander Median Household Income
COMPARE
Brazilian
U.S. Virgin Islander
Median Household Income
Median Household Income Comparison
Brazilians
U.S. Virgin Islanders
$88,934
MEDIAN HOUSEHOLD INCOME
92.1/ 100
METRIC RATING
129th/ 347
METRIC RANK
$71,853
MEDIAN HOUSEHOLD INCOME
0.0/ 100
METRIC RATING
310th/ 347
METRIC RANK
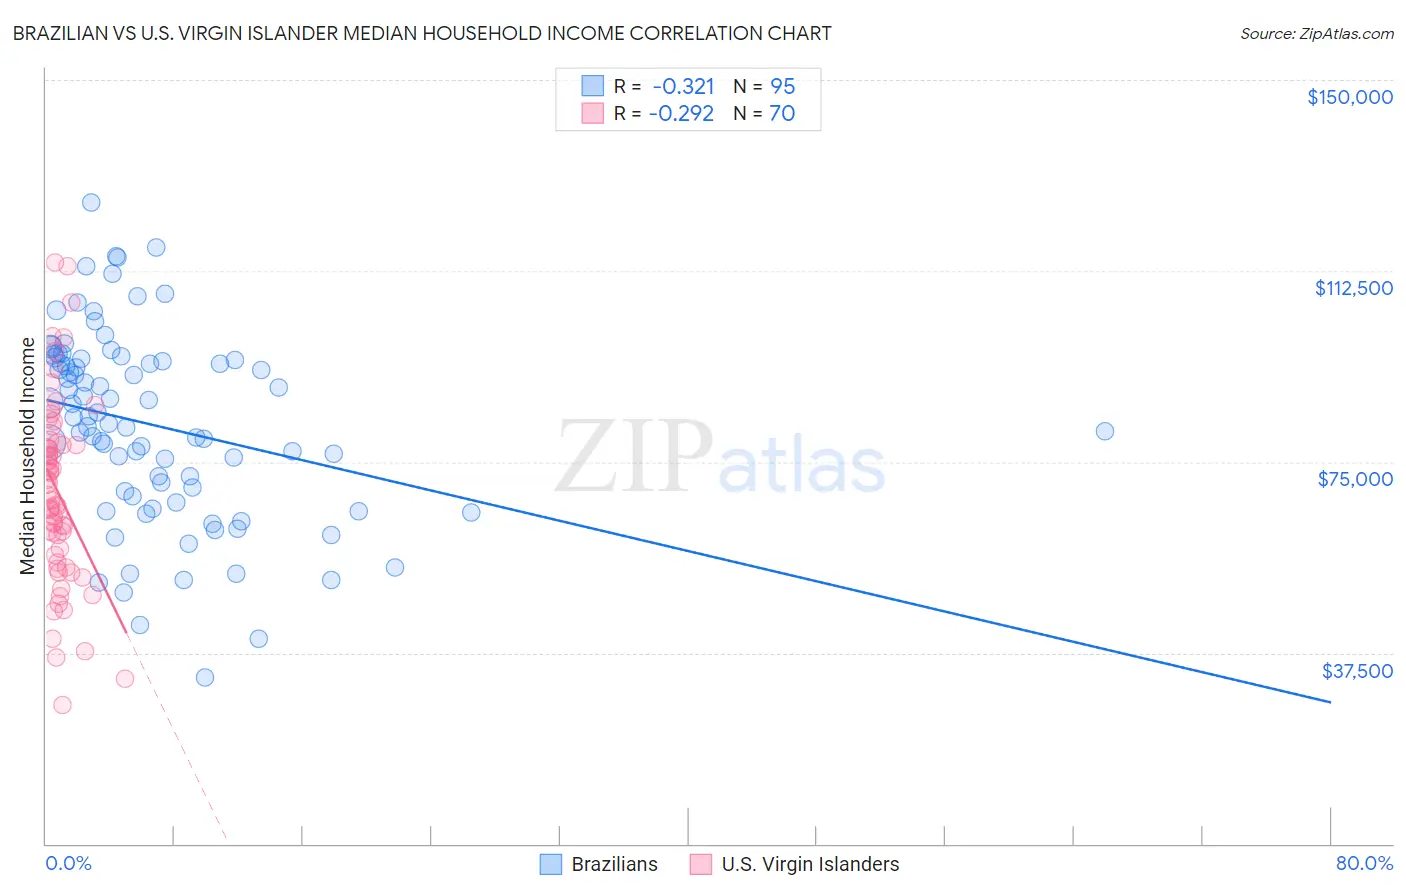
Brazilian vs U.S. Virgin Islander Median Household Income Correlation Chart
The statistical analysis conducted on geographies consisting of 323,646,187 people shows a mild negative correlation between the proportion of Brazilians and median household income in the United States with a correlation coefficient (R) of -0.321 and weighted average of $88,934. Similarly, the statistical analysis conducted on geographies consisting of 87,500,449 people shows a weak negative correlation between the proportion of U.S. Virgin Islanders and median household income in the United States with a correlation coefficient (R) of -0.292 and weighted average of $71,853, a difference of 23.8%.
Median Household Income Correlation Summary
| Measurement | Brazilian | U.S. Virgin Islander |
| Minimum | $32,591 | $27,212 |
| Maximum | $126,001 | $114,181 |
| Range | $93,410 | $86,969 |
| Mean | $82,158 | $69,001 |
| Median | $83,690 | $68,056 |
| Interquartile 25% (IQ1) | $68,333 | $56,650 |
| Interquartile 75% (IQ3) | $94,909 | $78,391 |
| Interquartile Range (IQR) | $26,576 | $21,741 |
| Standard Deviation (Sample) | $18,705 | $18,092 |
| Standard Deviation (Population) | $18,606 | $17,962 |
Similar Demographics by Median Household Income
Demographics Similar to Brazilians by Median Household Income
In terms of median household income, the demographic groups most similar to Brazilians are British ($88,914, a difference of 0.020%), Portuguese ($88,976, a difference of 0.050%), Immigrants from Peru ($89,010, a difference of 0.090%), Immigrants from Syria ($88,792, a difference of 0.16%), and Immigrants from Oceania ($89,100, a difference of 0.19%).
| Demographics | Rating | Rank | Median Household Income |
| Pakistanis | 94.8 /100 | #122 | Exceptional $89,638 |
| Immigrants | Zimbabwe | 94.4 /100 | #123 | Exceptional $89,496 |
| Immigrants | Jordan | 94.1 /100 | #124 | Exceptional $89,412 |
| Immigrants | Kuwait | 93.5 /100 | #125 | Exceptional $89,263 |
| Immigrants | Oceania | 92.9 /100 | #126 | Exceptional $89,100 |
| Immigrants | Peru | 92.5 /100 | #127 | Exceptional $89,010 |
| Portuguese | 92.3 /100 | #128 | Exceptional $88,976 |
| Brazilians | 92.1 /100 | #129 | Exceptional $88,934 |
| British | 92.0 /100 | #130 | Exceptional $88,914 |
| Immigrants | Syria | 91.4 /100 | #131 | Exceptional $88,792 |
| Europeans | 91.2 /100 | #132 | Exceptional $88,751 |
| Immigrants | Ethiopia | 90.9 /100 | #133 | Exceptional $88,687 |
| Swedes | 90.0 /100 | #134 | Exceptional $88,524 |
| Immigrants | Sierra Leone | 89.9 /100 | #135 | Excellent $88,498 |
| Poles | 89.7 /100 | #136 | Excellent $88,472 |
Demographics Similar to U.S. Virgin Islanders by Median Household Income
In terms of median household income, the demographic groups most similar to U.S. Virgin Islanders are Immigrants from Caribbean ($71,860, a difference of 0.010%), Immigrants from Zaire ($71,801, a difference of 0.070%), Yakama ($72,225, a difference of 0.52%), Immigrants from Honduras ($71,452, a difference of 0.56%), and Immigrants from Bahamas ($71,349, a difference of 0.71%).
| Demographics | Rating | Rank | Median Household Income |
| Africans | 0.0 /100 | #303 | Tragic $72,650 |
| Immigrants | Haiti | 0.0 /100 | #304 | Tragic $72,599 |
| Hondurans | 0.0 /100 | #305 | Tragic $72,588 |
| Potawatomi | 0.0 /100 | #306 | Tragic $72,576 |
| Ute | 0.0 /100 | #307 | Tragic $72,402 |
| Yakama | 0.0 /100 | #308 | Tragic $72,225 |
| Immigrants | Caribbean | 0.0 /100 | #309 | Tragic $71,860 |
| U.S. Virgin Islanders | 0.0 /100 | #310 | Tragic $71,853 |
| Immigrants | Zaire | 0.0 /100 | #311 | Tragic $71,801 |
| Immigrants | Honduras | 0.0 /100 | #312 | Tragic $71,452 |
| Immigrants | Bahamas | 0.0 /100 | #313 | Tragic $71,349 |
| Dominicans | 0.0 /100 | #314 | Tragic $71,302 |
| Ottawa | 0.0 /100 | #315 | Tragic $70,984 |
| Apache | 0.0 /100 | #316 | Tragic $70,927 |
| Cajuns | 0.0 /100 | #317 | Tragic $70,605 |