Shoshone vs Immigrants from Israel Median Household Income
COMPARE
Shoshone
Immigrants from Israel
Median Household Income
Median Household Income Comparison
Shoshone
Immigrants from Israel
$72,660
MEDIAN HOUSEHOLD INCOME
0.0/ 100
METRIC RATING
302nd/ 347
METRIC RANK
$104,090
MEDIAN HOUSEHOLD INCOME
100.0/ 100
METRIC RATING
15th/ 347
METRIC RANK
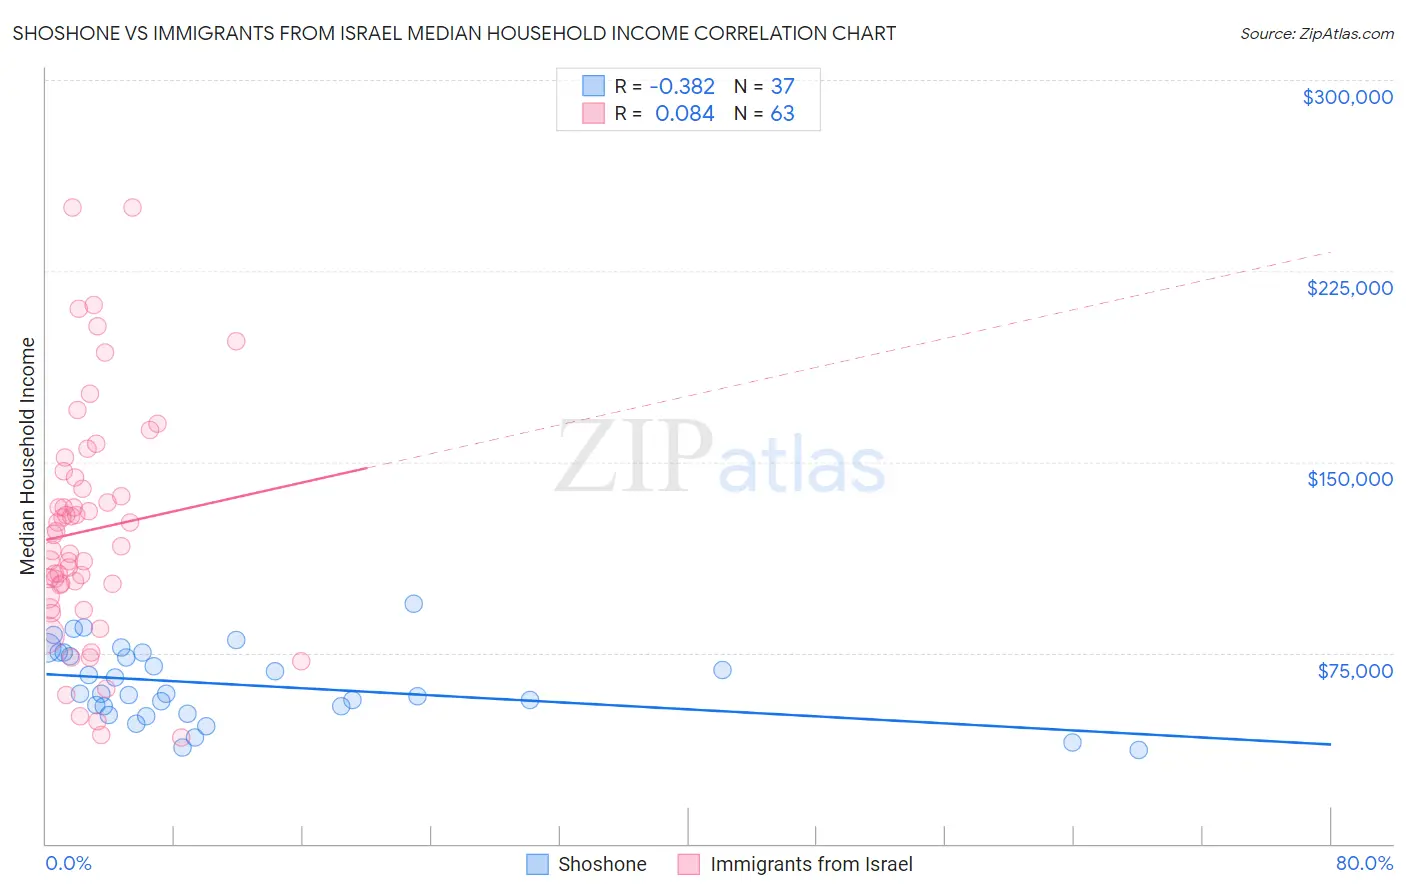
Shoshone vs Immigrants from Israel Median Household Income Correlation Chart
The statistical analysis conducted on geographies consisting of 66,612,449 people shows a mild negative correlation between the proportion of Shoshone and median household income in the United States with a correlation coefficient (R) of -0.382 and weighted average of $72,660. Similarly, the statistical analysis conducted on geographies consisting of 209,966,745 people shows a slight positive correlation between the proportion of Immigrants from Israel and median household income in the United States with a correlation coefficient (R) of 0.084 and weighted average of $104,090, a difference of 43.3%.
Median Household Income Correlation Summary
| Measurement | Shoshone | Immigrants from Israel |
| Minimum | $36,823 | $41,875 |
| Maximum | $94,375 | $250,001 |
| Range | $57,552 | $208,126 |
| Mean | $62,559 | $123,014 |
| Median | $58,750 | $116,644 |
| Interquartile 25% (IQ1) | $52,629 | $97,035 |
| Interquartile 75% (IQ3) | $75,002 | $143,680 |
| Interquartile Range (IQR) | $22,372 | $46,645 |
| Standard Deviation (Sample) | $14,416 | $45,941 |
| Standard Deviation (Population) | $14,219 | $45,575 |
Similar Demographics by Median Household Income
Demographics Similar to Shoshone by Median Household Income
In terms of median household income, the demographic groups most similar to Shoshone are African ($72,650, a difference of 0.010%), Cherokee ($72,682, a difference of 0.030%), Immigrants from Haiti ($72,599, a difference of 0.080%), Honduran ($72,588, a difference of 0.10%), and Potawatomi ($72,576, a difference of 0.12%).
| Demographics | Rating | Rank | Median Household Income |
| Cubans | 0.1 /100 | #295 | Tragic $73,392 |
| Haitians | 0.1 /100 | #296 | Tragic $73,306 |
| Immigrants | Mexico | 0.0 /100 | #297 | Tragic $73,160 |
| Paiute | 0.0 /100 | #298 | Tragic $72,959 |
| Indonesians | 0.0 /100 | #299 | Tragic $72,856 |
| Immigrants | Dominica | 0.0 /100 | #300 | Tragic $72,760 |
| Cherokee | 0.0 /100 | #301 | Tragic $72,682 |
| Shoshone | 0.0 /100 | #302 | Tragic $72,660 |
| Africans | 0.0 /100 | #303 | Tragic $72,650 |
| Immigrants | Haiti | 0.0 /100 | #304 | Tragic $72,599 |
| Hondurans | 0.0 /100 | #305 | Tragic $72,588 |
| Potawatomi | 0.0 /100 | #306 | Tragic $72,576 |
| Ute | 0.0 /100 | #307 | Tragic $72,402 |
| Yakama | 0.0 /100 | #308 | Tragic $72,225 |
| Immigrants | Caribbean | 0.0 /100 | #309 | Tragic $71,860 |
Demographics Similar to Immigrants from Israel by Median Household Income
In terms of median household income, the demographic groups most similar to Immigrants from Israel are Immigrants from Ireland ($104,692, a difference of 0.58%), Immigrants from Eastern Asia ($104,796, a difference of 0.68%), Burmese ($103,145, a difference of 0.92%), Immigrants from Korea ($102,962, a difference of 1.1%), and Indian (Asian) ($105,262, a difference of 1.1%).
| Demographics | Rating | Rank | Median Household Income |
| Immigrants | Iran | 100.0 /100 | #8 | Exceptional $108,055 |
| Okinawans | 100.0 /100 | #9 | Exceptional $106,624 |
| Immigrants | South Central Asia | 100.0 /100 | #10 | Exceptional $106,057 |
| Immigrants | China | 100.0 /100 | #11 | Exceptional $105,335 |
| Indians (Asian) | 100.0 /100 | #12 | Exceptional $105,262 |
| Immigrants | Eastern Asia | 100.0 /100 | #13 | Exceptional $104,796 |
| Immigrants | Ireland | 100.0 /100 | #14 | Exceptional $104,692 |
| Immigrants | Israel | 100.0 /100 | #15 | Exceptional $104,090 |
| Burmese | 100.0 /100 | #16 | Exceptional $103,145 |
| Immigrants | Korea | 100.0 /100 | #17 | Exceptional $102,962 |
| Cypriots | 100.0 /100 | #18 | Exceptional $102,843 |
| Immigrants | Australia | 100.0 /100 | #19 | Exceptional $102,562 |
| Bolivians | 100.0 /100 | #20 | Exceptional $102,195 |
| Eastern Europeans | 100.0 /100 | #21 | Exceptional $101,781 |
| Asians | 100.0 /100 | #22 | Exceptional $101,681 |