Delaware vs Immigrants from Israel Median Household Income
COMPARE
Delaware
Immigrants from Israel
Median Household Income
Median Household Income Comparison
Delaware
Immigrants from Israel
$80,527
MEDIAN HOUSEHOLD INCOME
5.0/ 100
METRIC RATING
229th/ 347
METRIC RANK
$104,090
MEDIAN HOUSEHOLD INCOME
100.0/ 100
METRIC RATING
15th/ 347
METRIC RANK
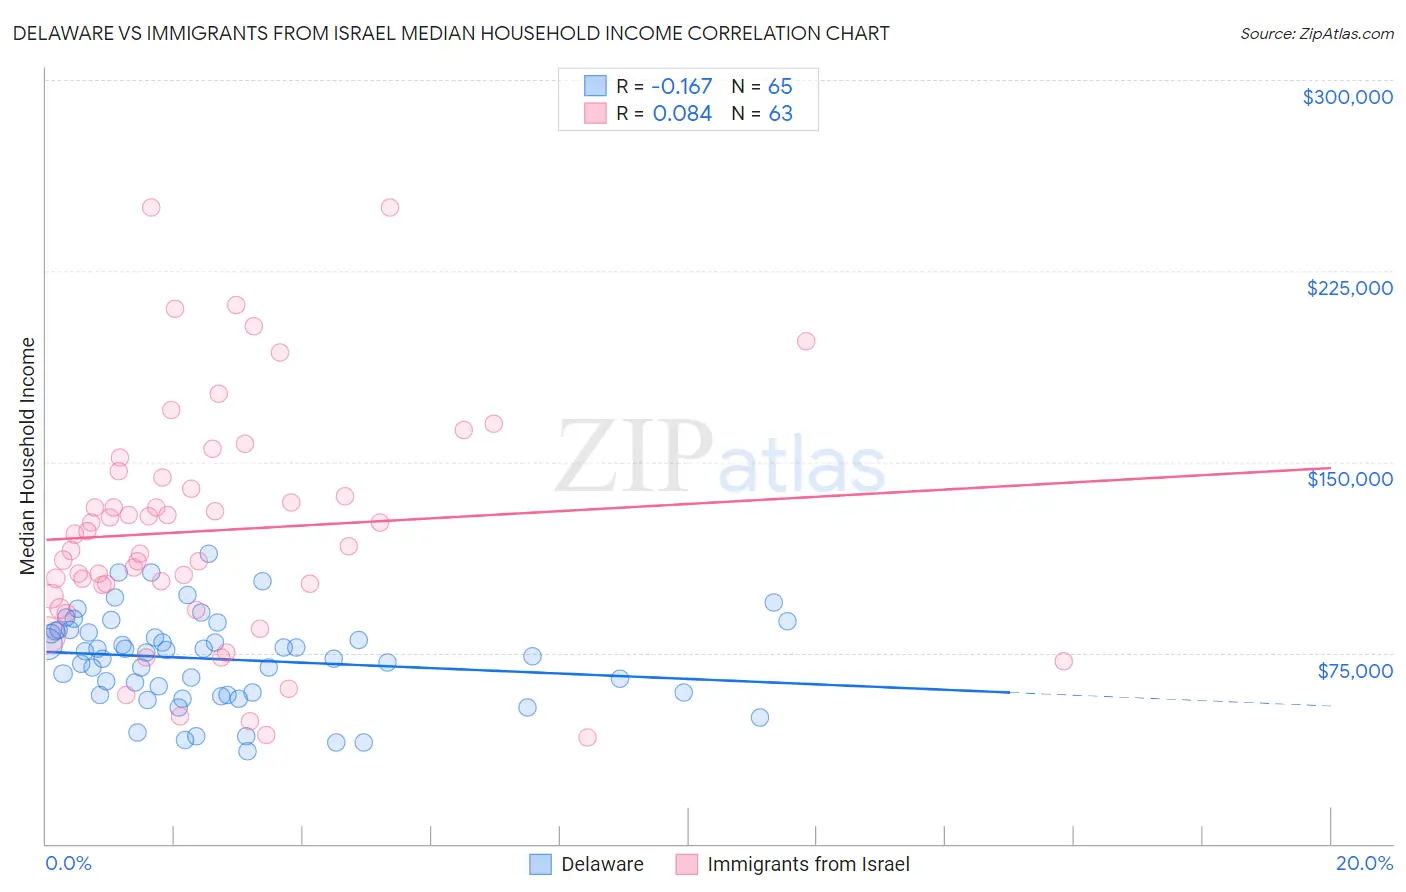
Delaware vs Immigrants from Israel Median Household Income Correlation Chart
The statistical analysis conducted on geographies consisting of 96,222,020 people shows a poor negative correlation between the proportion of Delaware and median household income in the United States with a correlation coefficient (R) of -0.167 and weighted average of $80,527. Similarly, the statistical analysis conducted on geographies consisting of 209,966,745 people shows a slight positive correlation between the proportion of Immigrants from Israel and median household income in the United States with a correlation coefficient (R) of 0.084 and weighted average of $104,090, a difference of 29.3%.
Median Household Income Correlation Summary
| Measurement | Delaware | Immigrants from Israel |
| Minimum | $36,250 | $41,875 |
| Maximum | $113,889 | $250,001 |
| Range | $77,639 | $208,126 |
| Mean | $72,395 | $123,014 |
| Median | $74,896 | $116,644 |
| Interquartile 25% (IQ1) | $59,089 | $97,035 |
| Interquartile 75% (IQ3) | $83,725 | $143,680 |
| Interquartile Range (IQR) | $24,635 | $46,645 |
| Standard Deviation (Sample) | $17,722 | $45,941 |
| Standard Deviation (Population) | $17,585 | $45,575 |
Similar Demographics by Median Household Income
Demographics Similar to Delaware by Median Household Income
In terms of median household income, the demographic groups most similar to Delaware are Bermudan ($80,406, a difference of 0.15%), Trinidadian and Tobagonian ($80,402, a difference of 0.16%), Immigrants from Trinidad and Tobago ($80,373, a difference of 0.19%), Immigrants from the Azores ($80,357, a difference of 0.21%), and Immigrants from Ecuador ($80,341, a difference of 0.23%).
| Demographics | Rating | Rank | Median Household Income |
| Immigrants | Nigeria | 7.7 /100 | #222 | Tragic $81,236 |
| Immigrants | El Salvador | 7.6 /100 | #223 | Tragic $81,213 |
| Malaysians | 7.0 /100 | #224 | Tragic $81,064 |
| Scotch-Irish | 6.6 /100 | #225 | Tragic $80,972 |
| Immigrants | Panama | 6.2 /100 | #226 | Tragic $80,873 |
| Guyanese | 5.7 /100 | #227 | Tragic $80,734 |
| Immigrants | Bangladesh | 5.7 /100 | #228 | Tragic $80,722 |
| Delaware | 5.0 /100 | #229 | Tragic $80,527 |
| Bermudans | 4.7 /100 | #230 | Tragic $80,406 |
| Trinidadians and Tobagonians | 4.7 /100 | #231 | Tragic $80,402 |
| Immigrants | Trinidad and Tobago | 4.6 /100 | #232 | Tragic $80,373 |
| Immigrants | Azores | 4.5 /100 | #233 | Tragic $80,357 |
| Immigrants | Ecuador | 4.5 /100 | #234 | Tragic $80,341 |
| Immigrants | Guyana | 4.5 /100 | #235 | Tragic $80,324 |
| Immigrants | Bosnia and Herzegovina | 3.4 /100 | #236 | Tragic $79,888 |
Demographics Similar to Immigrants from Israel by Median Household Income
In terms of median household income, the demographic groups most similar to Immigrants from Israel are Immigrants from Ireland ($104,692, a difference of 0.58%), Immigrants from Eastern Asia ($104,796, a difference of 0.68%), Burmese ($103,145, a difference of 0.92%), Immigrants from Korea ($102,962, a difference of 1.1%), and Indian (Asian) ($105,262, a difference of 1.1%).
| Demographics | Rating | Rank | Median Household Income |
| Immigrants | Iran | 100.0 /100 | #8 | Exceptional $108,055 |
| Okinawans | 100.0 /100 | #9 | Exceptional $106,624 |
| Immigrants | South Central Asia | 100.0 /100 | #10 | Exceptional $106,057 |
| Immigrants | China | 100.0 /100 | #11 | Exceptional $105,335 |
| Indians (Asian) | 100.0 /100 | #12 | Exceptional $105,262 |
| Immigrants | Eastern Asia | 100.0 /100 | #13 | Exceptional $104,796 |
| Immigrants | Ireland | 100.0 /100 | #14 | Exceptional $104,692 |
| Immigrants | Israel | 100.0 /100 | #15 | Exceptional $104,090 |
| Burmese | 100.0 /100 | #16 | Exceptional $103,145 |
| Immigrants | Korea | 100.0 /100 | #17 | Exceptional $102,962 |
| Cypriots | 100.0 /100 | #18 | Exceptional $102,843 |
| Immigrants | Australia | 100.0 /100 | #19 | Exceptional $102,562 |
| Bolivians | 100.0 /100 | #20 | Exceptional $102,195 |
| Eastern Europeans | 100.0 /100 | #21 | Exceptional $101,781 |
| Asians | 100.0 /100 | #22 | Exceptional $101,681 |