Apache vs Arab Bachelor's Degree
COMPARE
Apache
Arab
Bachelor's Degree
Bachelor's Degree Comparison
Apache
Arabs
28.3%
BACHELOR'S DEGREE
0.0/ 100
METRIC RATING
326th/ 347
METRIC RANK
40.9%
BACHELOR'S DEGREE
96.6/ 100
METRIC RATING
109th/ 347
METRIC RANK
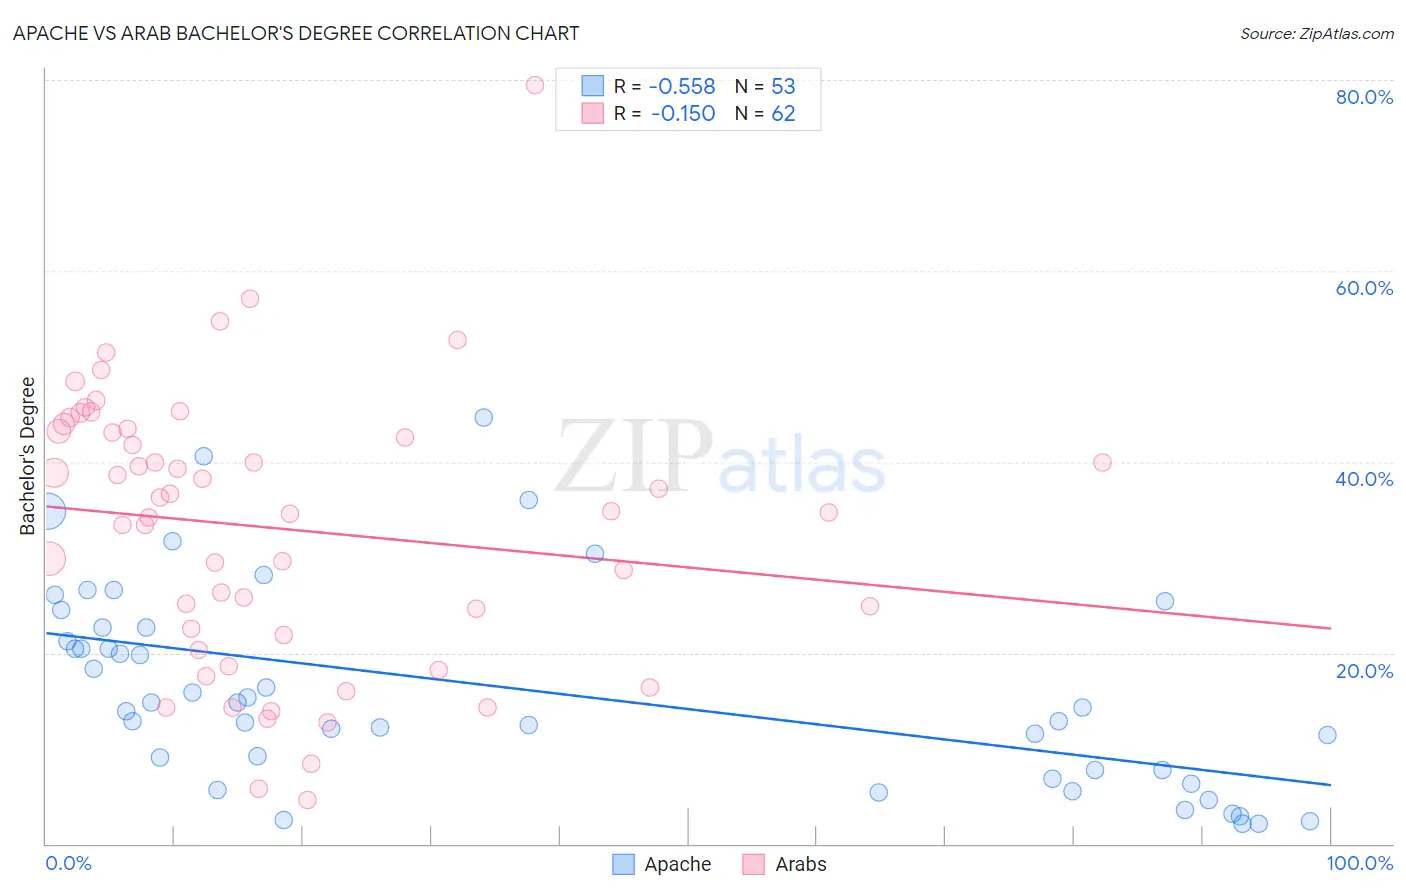
Apache vs Arab Bachelor's Degree Correlation Chart
The statistical analysis conducted on geographies consisting of 231,132,422 people shows a substantial negative correlation between the proportion of Apache and percentage of population with at least bachelor's degree education in the United States with a correlation coefficient (R) of -0.558 and weighted average of 28.3%. Similarly, the statistical analysis conducted on geographies consisting of 486,810,717 people shows a poor negative correlation between the proportion of Arabs and percentage of population with at least bachelor's degree education in the United States with a correlation coefficient (R) of -0.150 and weighted average of 40.9%, a difference of 44.6%.
Bachelor's Degree Correlation Summary
| Measurement | Apache | Arab |
| Minimum | 2.1% | 4.6% |
| Maximum | 44.7% | 79.5% |
| Range | 42.5% | 74.9% |
| Mean | 16.1% | 33.1% |
| Median | 14.3% | 34.8% |
| Interquartile 25% (IQ1) | 7.3% | 21.9% |
| Interquartile 75% (IQ3) | 22.7% | 43.2% |
| Interquartile Range (IQR) | 15.4% | 21.4% |
| Standard Deviation (Sample) | 10.5% | 14.4% |
| Standard Deviation (Population) | 10.4% | 14.3% |
Similar Demographics by Bachelor's Degree
Demographics Similar to Apache by Bachelor's Degree
In terms of bachelor's degree, the demographic groups most similar to Apache are Pennsylvania German (28.4%, a difference of 0.39%), Paiute (28.1%, a difference of 0.67%), Dutch West Indian (28.5%, a difference of 0.84%), Fijian (28.7%, a difference of 1.6%), and Tsimshian (28.8%, a difference of 1.7%).
| Demographics | Rating | Rank | Bachelor's Degree |
| Creek | 0.0 /100 | #319 | Tragic 28.9% |
| Kiowa | 0.0 /100 | #320 | Tragic 28.8% |
| Alaskan Athabascans | 0.0 /100 | #321 | Tragic 28.8% |
| Tsimshian | 0.0 /100 | #322 | Tragic 28.8% |
| Fijians | 0.0 /100 | #323 | Tragic 28.7% |
| Dutch West Indians | 0.0 /100 | #324 | Tragic 28.5% |
| Pennsylvania Germans | 0.0 /100 | #325 | Tragic 28.4% |
| Apache | 0.0 /100 | #326 | Tragic 28.3% |
| Paiute | 0.0 /100 | #327 | Tragic 28.1% |
| Crow | 0.0 /100 | #328 | Tragic 27.7% |
| Immigrants | Central America | 0.0 /100 | #329 | Tragic 27.5% |
| Spanish American Indians | 0.0 /100 | #330 | Tragic 27.5% |
| Immigrants | Azores | 0.0 /100 | #331 | Tragic 27.3% |
| Menominee | 0.0 /100 | #332 | Tragic 27.3% |
| Mexicans | 0.0 /100 | #333 | Tragic 27.1% |
Demographics Similar to Arabs by Bachelor's Degree
In terms of bachelor's degree, the demographic groups most similar to Arabs are Ukrainian (40.9%, a difference of 0.020%), Albanian (40.9%, a difference of 0.080%), Immigrants from Chile (40.8%, a difference of 0.12%), Northern European (41.0%, a difference of 0.16%), and Ugandan (40.8%, a difference of 0.17%).
| Demographics | Rating | Rank | Bachelor's Degree |
| Immigrants | Italy | 97.8 /100 | #102 | Exceptional 41.3% |
| Chileans | 97.5 /100 | #103 | Exceptional 41.2% |
| Jordanians | 97.4 /100 | #104 | Exceptional 41.2% |
| Syrians | 97.4 /100 | #105 | Exceptional 41.1% |
| Alsatians | 97.0 /100 | #106 | Exceptional 41.0% |
| Northern Europeans | 96.8 /100 | #107 | Exceptional 41.0% |
| Ukrainians | 96.6 /100 | #108 | Exceptional 40.9% |
| Arabs | 96.6 /100 | #109 | Exceptional 40.9% |
| Albanians | 96.5 /100 | #110 | Exceptional 40.9% |
| Immigrants | Chile | 96.4 /100 | #111 | Exceptional 40.8% |
| Ugandans | 96.3 /100 | #112 | Exceptional 40.8% |
| Brazilians | 96.3 /100 | #113 | Exceptional 40.8% |
| Afghans | 96.2 /100 | #114 | Exceptional 40.8% |
| Palestinians | 95.8 /100 | #115 | Exceptional 40.7% |
| Immigrants | Uganda | 95.7 /100 | #116 | Exceptional 40.7% |