American vs Native Hawaiian In Labor Force | Age > 16
COMPARE
American
Native Hawaiian
In Labor Force | Age > 16
In Labor Force | Age > 16 Comparison
Americans
Native Hawaiians
62.1%
IN LABOR FORCE | AGE > 16
0.0/ 100
METRIC RATING
321st/ 347
METRIC RANK
64.1%
IN LABOR FORCE | AGE > 16
0.3/ 100
METRIC RATING
272nd/ 347
METRIC RANK
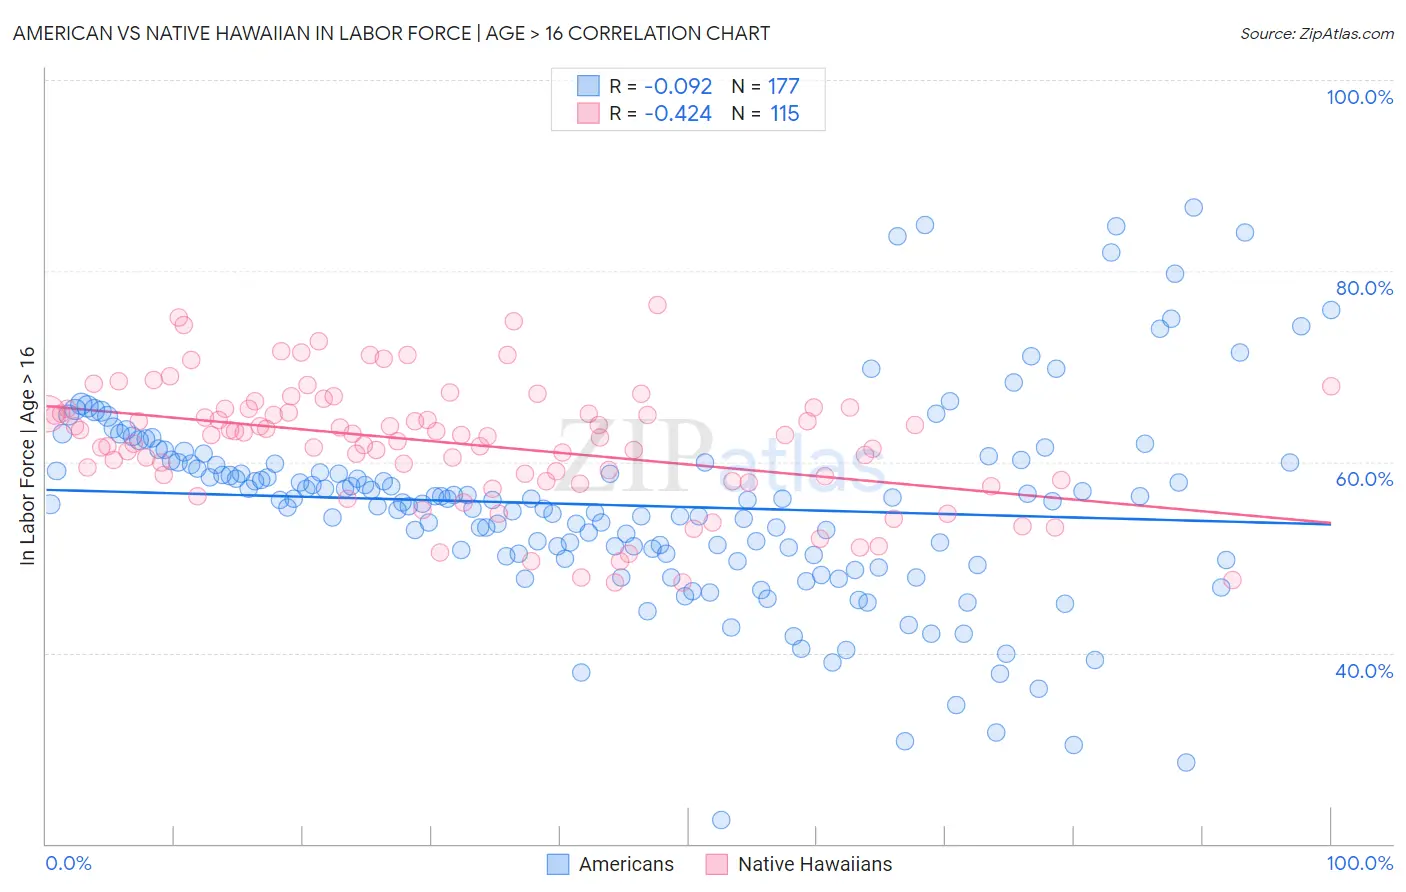
American vs Native Hawaiian In Labor Force | Age > 16 Correlation Chart
The statistical analysis conducted on geographies consisting of 581,977,870 people shows a slight negative correlation between the proportion of Americans and labor force participation rate among population ages 16 and over in the United States with a correlation coefficient (R) of -0.092 and weighted average of 62.1%. Similarly, the statistical analysis conducted on geographies consisting of 332,118,603 people shows a moderate negative correlation between the proportion of Native Hawaiians and labor force participation rate among population ages 16 and over in the United States with a correlation coefficient (R) of -0.424 and weighted average of 64.1%, a difference of 3.2%.
In Labor Force | Age > 16 Correlation Summary
| Measurement | American | Native Hawaiian |
| Minimum | 22.4% | 47.3% |
| Maximum | 86.7% | 76.4% |
| Range | 64.3% | 29.1% |
| Mean | 55.4% | 61.9% |
| Median | 56.0% | 62.8% |
| Interquartile 25% (IQ1) | 50.2% | 58.1% |
| Interquartile 75% (IQ3) | 59.9% | 65.6% |
| Interquartile Range (IQR) | 9.8% | 7.5% |
| Standard Deviation (Sample) | 10.5% | 6.3% |
| Standard Deviation (Population) | 10.4% | 6.3% |
Similar Demographics by In Labor Force | Age > 16
Demographics Similar to Americans by In Labor Force | Age > 16
In terms of in labor force | age > 16, the demographic groups most similar to Americans are Arapaho (62.1%, a difference of 0.040%), Yakama (62.1%, a difference of 0.040%), Ottawa (62.0%, a difference of 0.16%), Seminole (62.0%, a difference of 0.18%), and Cheyenne (62.0%, a difference of 0.22%).
| Demographics | Rating | Rank | In Labor Force | Age > 16 |
| Yaqui | 0.0 /100 | #314 | Tragic 63.0% |
| Potawatomi | 0.0 /100 | #315 | Tragic 62.8% |
| Yup'ik | 0.0 /100 | #316 | Tragic 62.7% |
| Kiowa | 0.0 /100 | #317 | Tragic 62.4% |
| Chickasaw | 0.0 /100 | #318 | Tragic 62.3% |
| Arapaho | 0.0 /100 | #319 | Tragic 62.1% |
| Yakama | 0.0 /100 | #320 | Tragic 62.1% |
| Americans | 0.0 /100 | #321 | Tragic 62.1% |
| Ottawa | 0.0 /100 | #322 | Tragic 62.0% |
| Seminole | 0.0 /100 | #323 | Tragic 62.0% |
| Cheyenne | 0.0 /100 | #324 | Tragic 62.0% |
| Cherokee | 0.0 /100 | #325 | Tragic 61.9% |
| Sioux | 0.0 /100 | #326 | Tragic 61.8% |
| Cajuns | 0.0 /100 | #327 | Tragic 61.8% |
| Dutch West Indians | 0.0 /100 | #328 | Tragic 61.7% |
Demographics Similar to Native Hawaiians by In Labor Force | Age > 16
In terms of in labor force | age > 16, the demographic groups most similar to Native Hawaiians are Hmong (64.1%, a difference of 0.0%), Immigrants from Cuba (64.1%, a difference of 0.020%), Mexican (64.1%, a difference of 0.020%), French American Indian (64.1%, a difference of 0.020%), and Guyanese (64.1%, a difference of 0.030%).
| Demographics | Rating | Rank | In Labor Force | Age > 16 |
| Cubans | 0.5 /100 | #265 | Tragic 64.2% |
| Immigrants | England | 0.5 /100 | #266 | Tragic 64.2% |
| Canadians | 0.5 /100 | #267 | Tragic 64.1% |
| Spaniards | 0.5 /100 | #268 | Tragic 64.1% |
| Irish | 0.4 /100 | #269 | Tragic 64.1% |
| Guyanese | 0.4 /100 | #270 | Tragic 64.1% |
| Dominicans | 0.4 /100 | #271 | Tragic 64.1% |
| Native Hawaiians | 0.3 /100 | #272 | Tragic 64.1% |
| Hmong | 0.3 /100 | #273 | Tragic 64.1% |
| Immigrants | Cuba | 0.3 /100 | #274 | Tragic 64.1% |
| Mexicans | 0.3 /100 | #275 | Tragic 64.1% |
| French American Indians | 0.3 /100 | #276 | Tragic 64.1% |
| Immigrants | Bahamas | 0.3 /100 | #277 | Tragic 64.0% |
| Assyrians/Chaldeans/Syriacs | 0.3 /100 | #278 | Tragic 64.0% |
| Welsh | 0.2 /100 | #279 | Tragic 64.0% |