American vs Irish Median Family Income
COMPARE
American
Irish
Median Family Income
Median Family Income Comparison
Americans
Irish
$92,096
MEDIAN FAMILY INCOME
0.4/ 100
METRIC RATING
257th/ 347
METRIC RANK
$105,453
MEDIAN FAMILY INCOME
80.5/ 100
METRIC RATING
150th/ 347
METRIC RANK
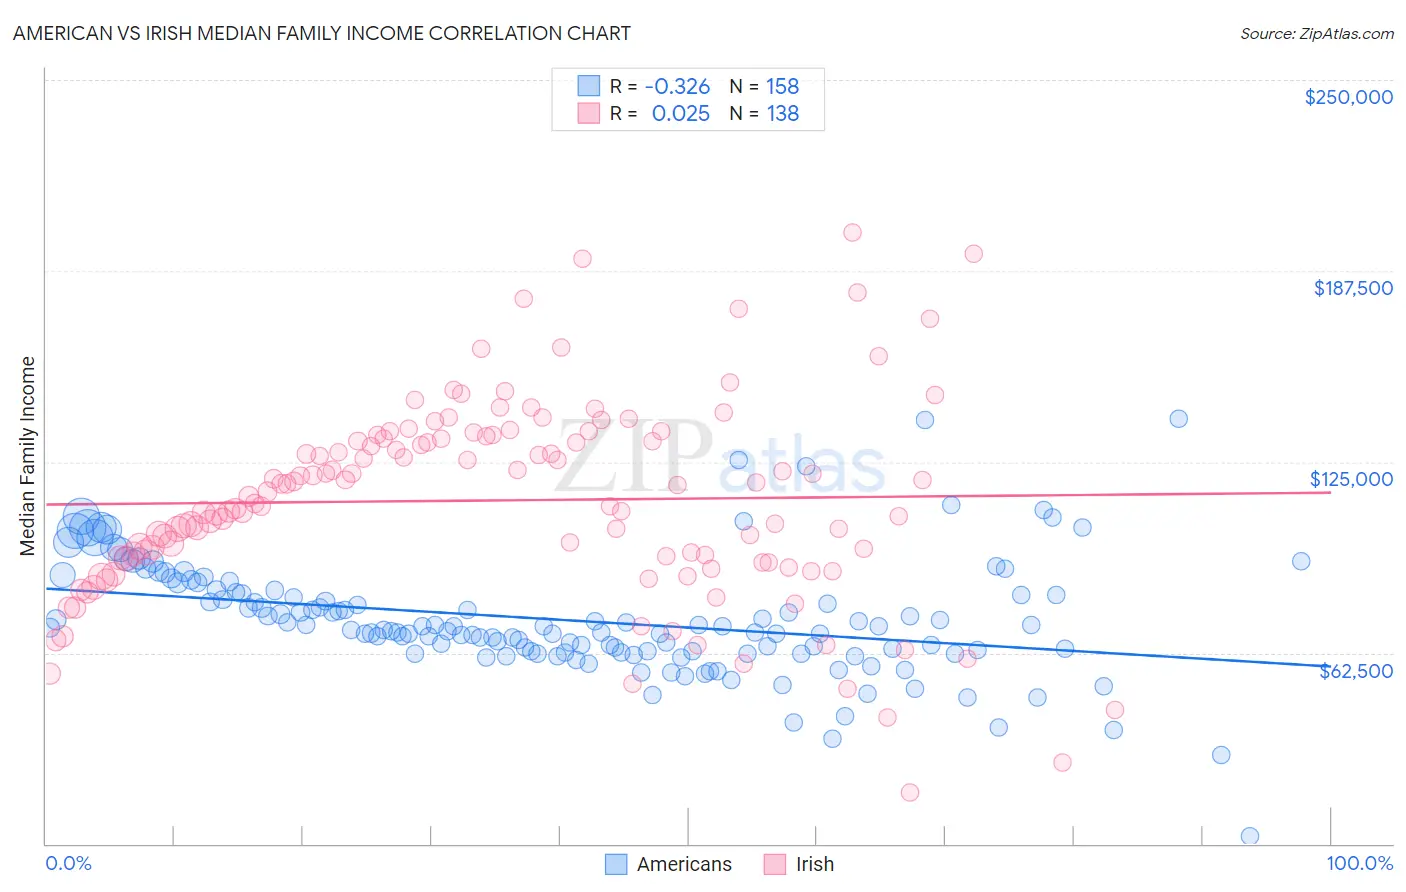
American vs Irish Median Family Income Correlation Chart
The statistical analysis conducted on geographies consisting of 580,248,843 people shows a mild negative correlation between the proportion of Americans and median family income in the United States with a correlation coefficient (R) of -0.326 and weighted average of $92,096. Similarly, the statistical analysis conducted on geographies consisting of 578,674,482 people shows no correlation between the proportion of Irish and median family income in the United States with a correlation coefficient (R) of 0.025 and weighted average of $105,453, a difference of 14.5%.
Median Family Income Correlation Summary
| Measurement | American | Irish |
| Minimum | $2,499 | $16,721 |
| Maximum | $139,235 | $200,267 |
| Range | $136,736 | $183,546 |
| Mean | $73,235 | $112,390 |
| Median | $70,309 | $114,410 |
| Interquartile 25% (IQ1) | $63,060 | $93,102 |
| Interquartile 75% (IQ3) | $81,871 | $132,553 |
| Interquartile Range (IQR) | $18,811 | $39,451 |
| Standard Deviation (Sample) | $18,957 | $32,421 |
| Standard Deviation (Population) | $18,897 | $32,303 |
Similar Demographics by Median Family Income
Demographics Similar to Americans by Median Family Income
In terms of median family income, the demographic groups most similar to Americans are Nicaraguan ($92,231, a difference of 0.15%), Immigrants from Laos ($92,239, a difference of 0.16%), Osage ($91,926, a difference of 0.19%), Cape Verdean ($91,848, a difference of 0.27%), and Immigrants from Barbados ($92,419, a difference of 0.35%).
| Demographics | Rating | Rank | Median Family Income |
| West Indians | 0.6 /100 | #250 | Tragic $92,765 |
| Immigrants | Somalia | 0.6 /100 | #251 | Tragic $92,609 |
| Immigrants | El Salvador | 0.6 /100 | #252 | Tragic $92,545 |
| Immigrants | Guyana | 0.6 /100 | #253 | Tragic $92,513 |
| Immigrants | Barbados | 0.5 /100 | #254 | Tragic $92,419 |
| Immigrants | Laos | 0.5 /100 | #255 | Tragic $92,239 |
| Nicaraguans | 0.5 /100 | #256 | Tragic $92,231 |
| Americans | 0.4 /100 | #257 | Tragic $92,096 |
| Osage | 0.4 /100 | #258 | Tragic $91,926 |
| Cape Verdeans | 0.4 /100 | #259 | Tragic $91,848 |
| Pennsylvania Germans | 0.4 /100 | #260 | Tragic $91,763 |
| Inupiat | 0.4 /100 | #261 | Tragic $91,730 |
| Liberians | 0.4 /100 | #262 | Tragic $91,722 |
| Immigrants | West Indies | 0.3 /100 | #263 | Tragic $91,588 |
| Senegalese | 0.3 /100 | #264 | Tragic $91,475 |
Demographics Similar to Irish by Median Family Income
In terms of median family income, the demographic groups most similar to Irish are Peruvian ($105,444, a difference of 0.010%), Immigrants from Germany ($105,507, a difference of 0.050%), Hungarian ($105,609, a difference of 0.15%), Immigrants from Albania ($105,285, a difference of 0.16%), and Immigrants from Chile ($105,655, a difference of 0.19%).
| Demographics | Rating | Rank | Median Family Income |
| Tongans | 84.3 /100 | #143 | Excellent $105,967 |
| Immigrants | Morocco | 84.3 /100 | #144 | Excellent $105,964 |
| Danes | 83.8 /100 | #145 | Excellent $105,900 |
| Czechs | 83.4 /100 | #146 | Excellent $105,839 |
| Immigrants | Chile | 82.1 /100 | #147 | Excellent $105,655 |
| Hungarians | 81.7 /100 | #148 | Excellent $105,609 |
| Immigrants | Germany | 80.9 /100 | #149 | Excellent $105,507 |
| Irish | 80.5 /100 | #150 | Excellent $105,453 |
| Peruvians | 80.4 /100 | #151 | Excellent $105,444 |
| Immigrants | Albania | 79.1 /100 | #152 | Good $105,285 |
| Slavs | 77.9 /100 | #153 | Good $105,144 |
| Immigrants | Nepal | 76.3 /100 | #154 | Good $104,966 |
| Native Hawaiians | 75.8 /100 | #155 | Good $104,910 |
| Basques | 74.4 /100 | #156 | Good $104,760 |
| Moroccans | 71.6 /100 | #157 | Good $104,488 |