Immigrants from Western Asia vs Irish Median Family Income
COMPARE
Immigrants from Western Asia
Irish
Median Family Income
Median Family Income Comparison
Immigrants from Western Asia
Irish
$108,691
MEDIAN FAMILY INCOME
95.6/ 100
METRIC RATING
111th/ 347
METRIC RANK
$105,453
MEDIAN FAMILY INCOME
80.5/ 100
METRIC RATING
150th/ 347
METRIC RANK
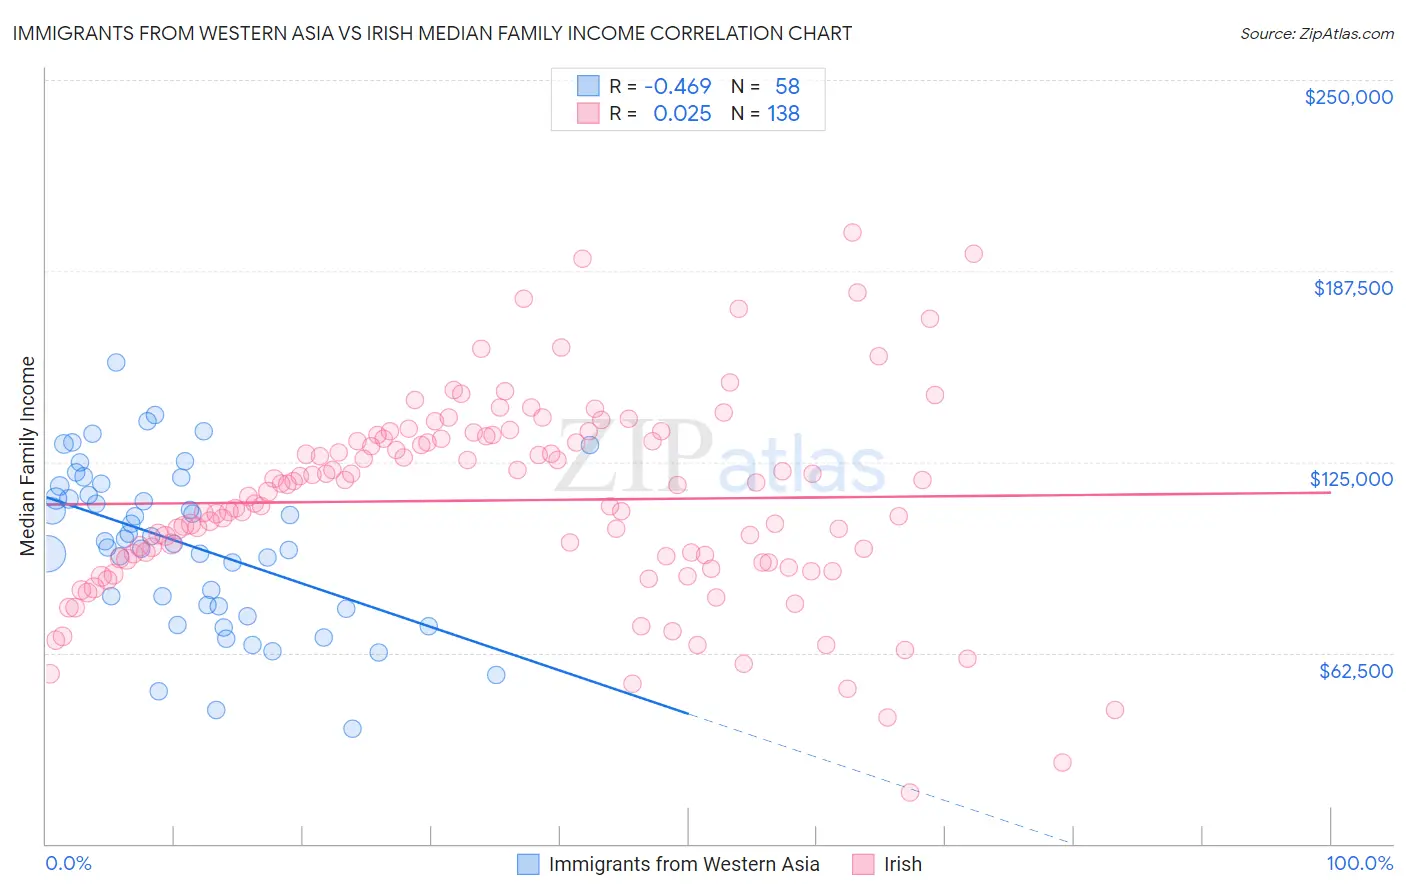
Immigrants from Western Asia vs Irish Median Family Income Correlation Chart
The statistical analysis conducted on geographies consisting of 404,054,166 people shows a moderate negative correlation between the proportion of Immigrants from Western Asia and median family income in the United States with a correlation coefficient (R) of -0.469 and weighted average of $108,691. Similarly, the statistical analysis conducted on geographies consisting of 578,674,482 people shows no correlation between the proportion of Irish and median family income in the United States with a correlation coefficient (R) of 0.025 and weighted average of $105,453, a difference of 3.1%.
Median Family Income Correlation Summary
| Measurement | Immigrants from Western Asia | Irish |
| Minimum | $37,540 | $16,721 |
| Maximum | $157,455 | $200,267 |
| Range | $119,915 | $183,546 |
| Mean | $98,085 | $112,390 |
| Median | $99,522 | $114,410 |
| Interquartile 25% (IQ1) | $77,576 | $93,102 |
| Interquartile 75% (IQ3) | $117,037 | $132,553 |
| Interquartile Range (IQR) | $39,461 | $39,451 |
| Standard Deviation (Sample) | $26,265 | $32,421 |
| Standard Deviation (Population) | $26,038 | $32,303 |
Similar Demographics by Median Family Income
Demographics Similar to Immigrants from Western Asia by Median Family Income
In terms of median family income, the demographic groups most similar to Immigrants from Western Asia are British ($108,705, a difference of 0.010%), Immigrants from Afghanistan ($108,709, a difference of 0.020%), Immigrants from Poland ($108,570, a difference of 0.11%), Immigrants from Zimbabwe ($108,830, a difference of 0.13%), and Immigrants from Saudi Arabia ($108,544, a difference of 0.14%).
| Demographics | Rating | Rank | Median Family Income |
| Palestinians | 96.9 /100 | #104 | Exceptional $109,413 |
| Syrians | 96.7 /100 | #105 | Exceptional $109,299 |
| Albanians | 96.4 /100 | #106 | Exceptional $109,136 |
| Immigrants | North Macedonia | 96.4 /100 | #107 | Exceptional $109,136 |
| Immigrants | Zimbabwe | 95.9 /100 | #108 | Exceptional $108,830 |
| Immigrants | Afghanistan | 95.6 /100 | #109 | Exceptional $108,709 |
| British | 95.6 /100 | #110 | Exceptional $108,705 |
| Immigrants | Western Asia | 95.6 /100 | #111 | Exceptional $108,691 |
| Immigrants | Poland | 95.3 /100 | #112 | Exceptional $108,570 |
| Immigrants | Saudi Arabia | 95.2 /100 | #113 | Exceptional $108,544 |
| Poles | 95.2 /100 | #114 | Exceptional $108,507 |
| Swedes | 95.1 /100 | #115 | Exceptional $108,499 |
| Chileans | 95.0 /100 | #116 | Exceptional $108,429 |
| Immigrants | Philippines | 94.6 /100 | #117 | Exceptional $108,288 |
| Ethiopians | 94.5 /100 | #118 | Exceptional $108,251 |
Demographics Similar to Irish by Median Family Income
In terms of median family income, the demographic groups most similar to Irish are Peruvian ($105,444, a difference of 0.010%), Immigrants from Germany ($105,507, a difference of 0.050%), Hungarian ($105,609, a difference of 0.15%), Immigrants from Albania ($105,285, a difference of 0.16%), and Immigrants from Chile ($105,655, a difference of 0.19%).
| Demographics | Rating | Rank | Median Family Income |
| Tongans | 84.3 /100 | #143 | Excellent $105,967 |
| Immigrants | Morocco | 84.3 /100 | #144 | Excellent $105,964 |
| Danes | 83.8 /100 | #145 | Excellent $105,900 |
| Czechs | 83.4 /100 | #146 | Excellent $105,839 |
| Immigrants | Chile | 82.1 /100 | #147 | Excellent $105,655 |
| Hungarians | 81.7 /100 | #148 | Excellent $105,609 |
| Immigrants | Germany | 80.9 /100 | #149 | Excellent $105,507 |
| Irish | 80.5 /100 | #150 | Excellent $105,453 |
| Peruvians | 80.4 /100 | #151 | Excellent $105,444 |
| Immigrants | Albania | 79.1 /100 | #152 | Good $105,285 |
| Slavs | 77.9 /100 | #153 | Good $105,144 |
| Immigrants | Nepal | 76.3 /100 | #154 | Good $104,966 |
| Native Hawaiians | 75.8 /100 | #155 | Good $104,910 |
| Basques | 74.4 /100 | #156 | Good $104,760 |
| Moroccans | 71.6 /100 | #157 | Good $104,488 |