American vs Immigrants from Trinidad and Tobago Median Family Income
COMPARE
American
Immigrants from Trinidad and Tobago
Median Family Income
Median Family Income Comparison
Americans
Immigrants from Trinidad and Tobago
$92,096
MEDIAN FAMILY INCOME
0.4/ 100
METRIC RATING
257th/ 347
METRIC RANK
$93,988
MEDIAN FAMILY INCOME
1.2/ 100
METRIC RATING
241st/ 347
METRIC RANK
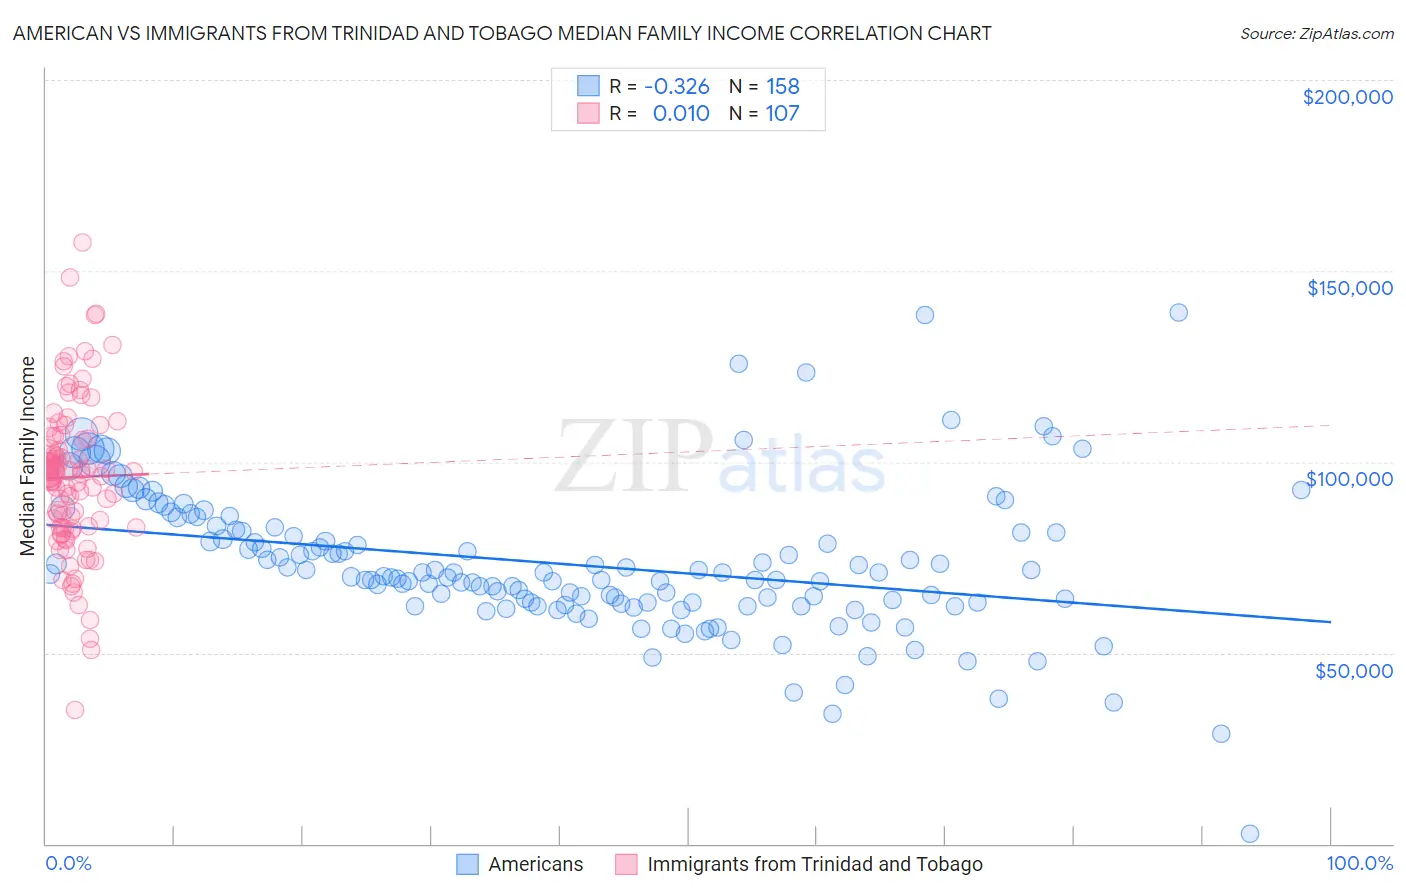
American vs Immigrants from Trinidad and Tobago Median Family Income Correlation Chart
The statistical analysis conducted on geographies consisting of 580,248,843 people shows a mild negative correlation between the proportion of Americans and median family income in the United States with a correlation coefficient (R) of -0.326 and weighted average of $92,096. Similarly, the statistical analysis conducted on geographies consisting of 223,463,571 people shows no correlation between the proportion of Immigrants from Trinidad and Tobago and median family income in the United States with a correlation coefficient (R) of 0.010 and weighted average of $93,988, a difference of 2.1%.
Median Family Income Correlation Summary
| Measurement | American | Immigrants from Trinidad and Tobago |
| Minimum | $2,499 | $35,148 |
| Maximum | $139,235 | $157,500 |
| Range | $136,736 | $122,352 |
| Mean | $73,235 | $95,978 |
| Median | $70,309 | $96,780 |
| Interquartile 25% (IQ1) | $63,060 | $82,831 |
| Interquartile 75% (IQ3) | $81,871 | $106,554 |
| Interquartile Range (IQR) | $18,811 | $23,723 |
| Standard Deviation (Sample) | $18,957 | $20,068 |
| Standard Deviation (Population) | $18,897 | $19,974 |
Demographics Similar to Americans and Immigrants from Trinidad and Tobago by Median Family Income
In terms of median family income, the demographic groups most similar to Americans are Nicaraguan ($92,231, a difference of 0.15%), Immigrants from Laos ($92,239, a difference of 0.16%), Osage ($91,926, a difference of 0.19%), Cape Verdean ($91,848, a difference of 0.27%), and Immigrants from Barbados ($92,419, a difference of 0.35%). Similarly, the demographic groups most similar to Immigrants from Trinidad and Tobago are Barbadian ($93,919, a difference of 0.070%), Somali ($94,085, a difference of 0.10%), Salvadoran ($94,109, a difference of 0.13%), German Russian ($93,858, a difference of 0.14%), and Subsaharan African ($93,748, a difference of 0.26%).
| Demographics | Rating | Rank | Median Family Income |
| Salvadorans | 1.2 /100 | #239 | Tragic $94,109 |
| Somalis | 1.2 /100 | #240 | Tragic $94,085 |
| Immigrants | Trinidad and Tobago | 1.2 /100 | #241 | Tragic $93,988 |
| Barbadians | 1.1 /100 | #242 | Tragic $93,919 |
| German Russians | 1.1 /100 | #243 | Tragic $93,858 |
| Sub-Saharan Africans | 1.0 /100 | #244 | Tragic $93,748 |
| Immigrants | Middle Africa | 1.0 /100 | #245 | Tragic $93,593 |
| Guyanese | 0.9 /100 | #246 | Tragic $93,373 |
| Immigrants | Senegal | 0.7 /100 | #247 | Tragic $92,912 |
| French American Indians | 0.7 /100 | #248 | Tragic $92,872 |
| Immigrants | Ecuador | 0.7 /100 | #249 | Tragic $92,837 |
| West Indians | 0.6 /100 | #250 | Tragic $92,765 |
| Immigrants | Somalia | 0.6 /100 | #251 | Tragic $92,609 |
| Immigrants | El Salvador | 0.6 /100 | #252 | Tragic $92,545 |
| Immigrants | Guyana | 0.6 /100 | #253 | Tragic $92,513 |
| Immigrants | Barbados | 0.5 /100 | #254 | Tragic $92,419 |
| Immigrants | Laos | 0.5 /100 | #255 | Tragic $92,239 |
| Nicaraguans | 0.5 /100 | #256 | Tragic $92,231 |
| Americans | 0.4 /100 | #257 | Tragic $92,096 |
| Osage | 0.4 /100 | #258 | Tragic $91,926 |
| Cape Verdeans | 0.4 /100 | #259 | Tragic $91,848 |