American vs Immigrants from Bahamas Median Family Income
COMPARE
American
Immigrants from Bahamas
Median Family Income
Median Family Income Comparison
Americans
Immigrants from Bahamas
$92,096
MEDIAN FAMILY INCOME
0.4/ 100
METRIC RATING
257th/ 347
METRIC RANK
$84,732
MEDIAN FAMILY INCOME
0.0/ 100
METRIC RATING
314th/ 347
METRIC RANK
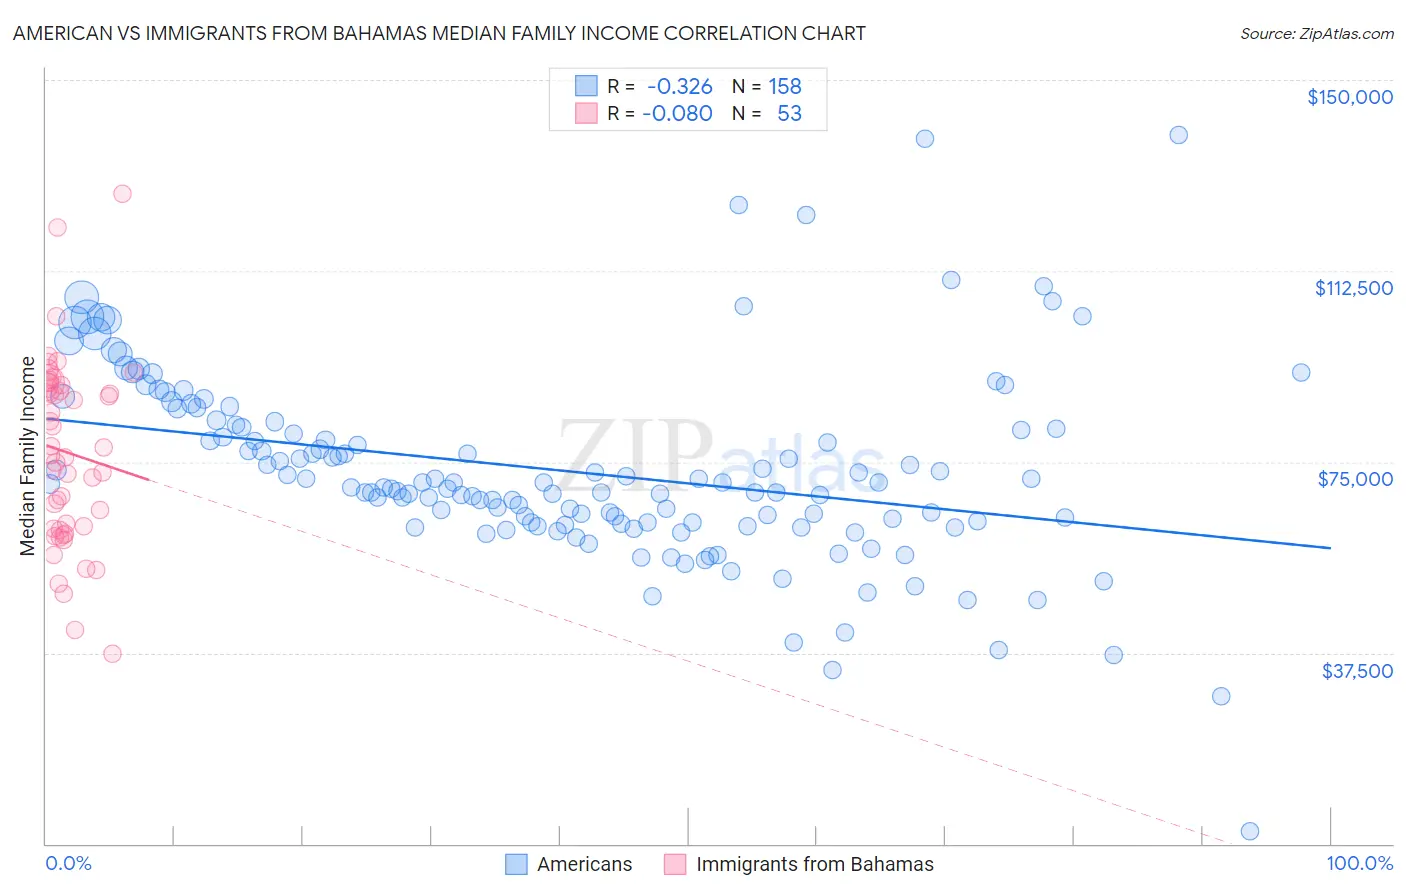
American vs Immigrants from Bahamas Median Family Income Correlation Chart
The statistical analysis conducted on geographies consisting of 580,248,843 people shows a mild negative correlation between the proportion of Americans and median family income in the United States with a correlation coefficient (R) of -0.326 and weighted average of $92,096. Similarly, the statistical analysis conducted on geographies consisting of 104,583,914 people shows a slight negative correlation between the proportion of Immigrants from Bahamas and median family income in the United States with a correlation coefficient (R) of -0.080 and weighted average of $84,732, a difference of 8.7%.
Median Family Income Correlation Summary
| Measurement | American | Immigrants from Bahamas |
| Minimum | $2,499 | $37,231 |
| Maximum | $139,235 | $127,688 |
| Range | $136,736 | $90,457 |
| Mean | $73,235 | $76,834 |
| Median | $70,309 | $76,465 |
| Interquartile 25% (IQ1) | $63,060 | $61,742 |
| Interquartile 75% (IQ3) | $81,871 | $90,302 |
| Interquartile Range (IQR) | $18,811 | $28,560 |
| Standard Deviation (Sample) | $18,957 | $18,260 |
| Standard Deviation (Population) | $18,897 | $18,087 |
Similar Demographics by Median Family Income
Demographics Similar to Americans by Median Family Income
In terms of median family income, the demographic groups most similar to Americans are Nicaraguan ($92,231, a difference of 0.15%), Immigrants from Laos ($92,239, a difference of 0.16%), Osage ($91,926, a difference of 0.19%), Cape Verdean ($91,848, a difference of 0.27%), and Immigrants from Barbados ($92,419, a difference of 0.35%).
| Demographics | Rating | Rank | Median Family Income |
| West Indians | 0.6 /100 | #250 | Tragic $92,765 |
| Immigrants | Somalia | 0.6 /100 | #251 | Tragic $92,609 |
| Immigrants | El Salvador | 0.6 /100 | #252 | Tragic $92,545 |
| Immigrants | Guyana | 0.6 /100 | #253 | Tragic $92,513 |
| Immigrants | Barbados | 0.5 /100 | #254 | Tragic $92,419 |
| Immigrants | Laos | 0.5 /100 | #255 | Tragic $92,239 |
| Nicaraguans | 0.5 /100 | #256 | Tragic $92,231 |
| Americans | 0.4 /100 | #257 | Tragic $92,096 |
| Osage | 0.4 /100 | #258 | Tragic $91,926 |
| Cape Verdeans | 0.4 /100 | #259 | Tragic $91,848 |
| Pennsylvania Germans | 0.4 /100 | #260 | Tragic $91,763 |
| Inupiat | 0.4 /100 | #261 | Tragic $91,730 |
| Liberians | 0.4 /100 | #262 | Tragic $91,722 |
| Immigrants | West Indies | 0.3 /100 | #263 | Tragic $91,588 |
| Senegalese | 0.3 /100 | #264 | Tragic $91,475 |
Demographics Similar to Immigrants from Bahamas by Median Family Income
In terms of median family income, the demographic groups most similar to Immigrants from Bahamas are Choctaw ($84,835, a difference of 0.12%), Cuban ($84,981, a difference of 0.29%), Honduran ($85,004, a difference of 0.32%), Apache ($84,451, a difference of 0.33%), and Immigrants from Central America ($85,050, a difference of 0.37%).
| Demographics | Rating | Rank | Median Family Income |
| Chickasaw | 0.0 /100 | #307 | Tragic $85,356 |
| U.S. Virgin Islanders | 0.0 /100 | #308 | Tragic $85,294 |
| Haitians | 0.0 /100 | #309 | Tragic $85,218 |
| Immigrants | Central America | 0.0 /100 | #310 | Tragic $85,050 |
| Hondurans | 0.0 /100 | #311 | Tragic $85,004 |
| Cubans | 0.0 /100 | #312 | Tragic $84,981 |
| Choctaw | 0.0 /100 | #313 | Tragic $84,835 |
| Immigrants | Bahamas | 0.0 /100 | #314 | Tragic $84,732 |
| Apache | 0.0 /100 | #315 | Tragic $84,451 |
| Immigrants | Haiti | 0.0 /100 | #316 | Tragic $84,018 |
| Yakama | 0.0 /100 | #317 | Tragic $83,932 |
| Immigrants | Mexico | 0.0 /100 | #318 | Tragic $83,639 |
| Immigrants | Honduras | 0.0 /100 | #319 | Tragic $83,618 |
| Seminole | 0.0 /100 | #320 | Tragic $83,354 |
| Immigrants | Caribbean | 0.0 /100 | #321 | Tragic $83,319 |