American vs Immigrants from El Salvador Median Family Income
COMPARE
American
Immigrants from El Salvador
Median Family Income
Median Family Income Comparison
Americans
Immigrants from El Salvador
$92,096
MEDIAN FAMILY INCOME
0.4/ 100
METRIC RATING
257th/ 347
METRIC RANK
$92,545
MEDIAN FAMILY INCOME
0.6/ 100
METRIC RATING
252nd/ 347
METRIC RANK
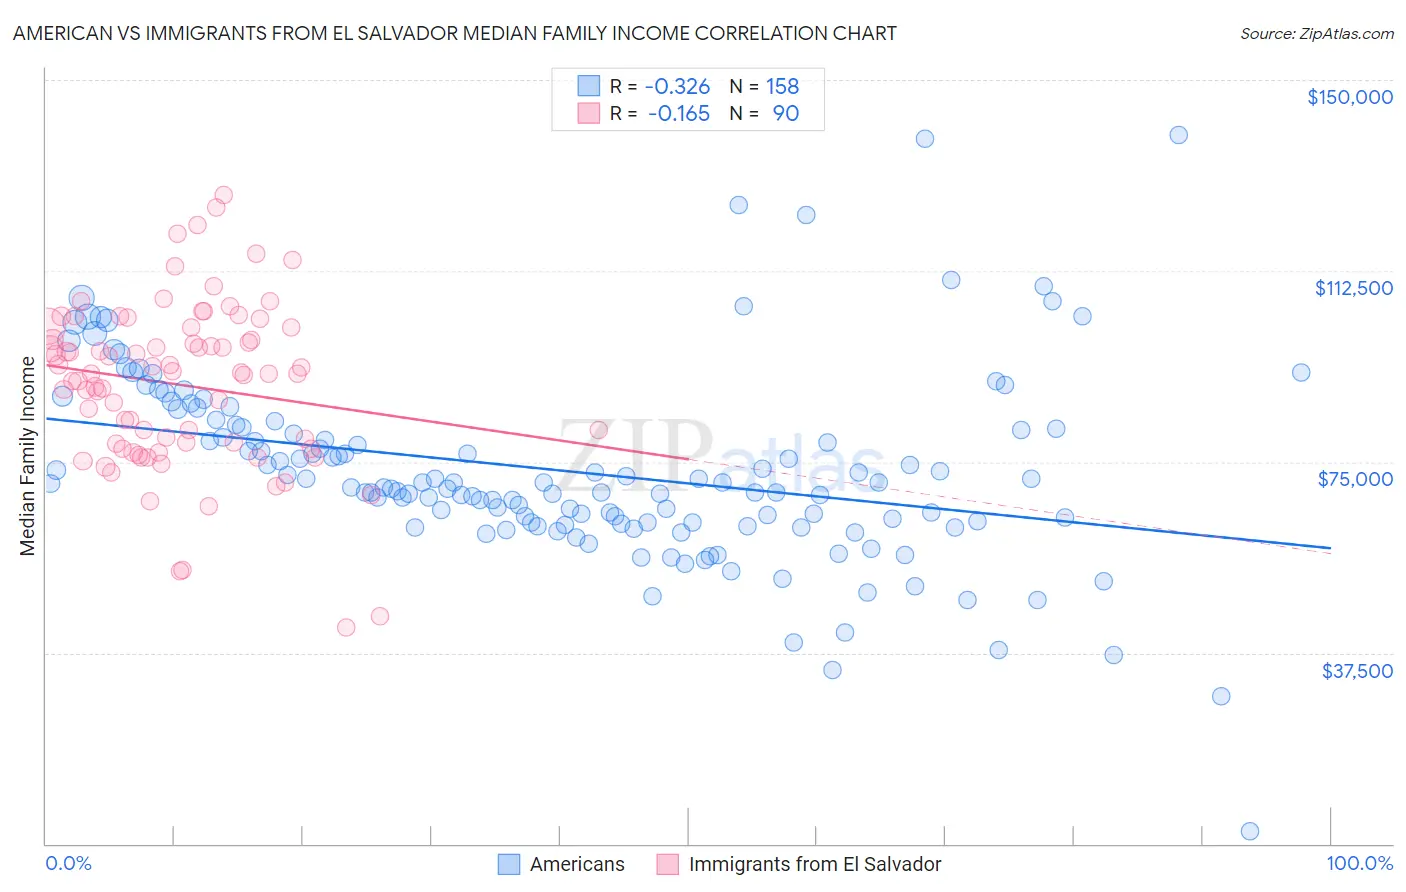
American vs Immigrants from El Salvador Median Family Income Correlation Chart
The statistical analysis conducted on geographies consisting of 580,248,843 people shows a mild negative correlation between the proportion of Americans and median family income in the United States with a correlation coefficient (R) of -0.326 and weighted average of $92,096. Similarly, the statistical analysis conducted on geographies consisting of 357,645,519 people shows a poor negative correlation between the proportion of Immigrants from El Salvador and median family income in the United States with a correlation coefficient (R) of -0.165 and weighted average of $92,545, a difference of 0.49%.
Median Family Income Correlation Summary
| Measurement | American | Immigrants from El Salvador |
| Minimum | $2,499 | $42,420 |
| Maximum | $139,235 | $127,446 |
| Range | $136,736 | $85,026 |
| Mean | $73,235 | $90,153 |
| Median | $70,309 | $92,338 |
| Interquartile 25% (IQ1) | $63,060 | $78,680 |
| Interquartile 75% (IQ3) | $81,871 | $101,462 |
| Interquartile Range (IQR) | $18,811 | $22,782 |
| Standard Deviation (Sample) | $18,957 | $16,234 |
| Standard Deviation (Population) | $18,897 | $16,143 |
Demographics Similar to Americans and Immigrants from El Salvador by Median Family Income
In terms of median family income, the demographic groups most similar to Americans are Nicaraguan ($92,231, a difference of 0.15%), Immigrants from Laos ($92,239, a difference of 0.16%), Osage ($91,926, a difference of 0.19%), Cape Verdean ($91,848, a difference of 0.27%), and Immigrants from Barbados ($92,419, a difference of 0.35%). Similarly, the demographic groups most similar to Immigrants from El Salvador are Immigrants from Guyana ($92,513, a difference of 0.030%), Immigrants from Somalia ($92,609, a difference of 0.070%), Immigrants from Barbados ($92,419, a difference of 0.14%), West Indian ($92,765, a difference of 0.24%), and Immigrants from Ecuador ($92,837, a difference of 0.32%).
| Demographics | Rating | Rank | Median Family Income |
| Sub-Saharan Africans | 1.0 /100 | #244 | Tragic $93,748 |
| Immigrants | Middle Africa | 1.0 /100 | #245 | Tragic $93,593 |
| Guyanese | 0.9 /100 | #246 | Tragic $93,373 |
| Immigrants | Senegal | 0.7 /100 | #247 | Tragic $92,912 |
| French American Indians | 0.7 /100 | #248 | Tragic $92,872 |
| Immigrants | Ecuador | 0.7 /100 | #249 | Tragic $92,837 |
| West Indians | 0.6 /100 | #250 | Tragic $92,765 |
| Immigrants | Somalia | 0.6 /100 | #251 | Tragic $92,609 |
| Immigrants | El Salvador | 0.6 /100 | #252 | Tragic $92,545 |
| Immigrants | Guyana | 0.6 /100 | #253 | Tragic $92,513 |
| Immigrants | Barbados | 0.5 /100 | #254 | Tragic $92,419 |
| Immigrants | Laos | 0.5 /100 | #255 | Tragic $92,239 |
| Nicaraguans | 0.5 /100 | #256 | Tragic $92,231 |
| Americans | 0.4 /100 | #257 | Tragic $92,096 |
| Osage | 0.4 /100 | #258 | Tragic $91,926 |
| Cape Verdeans | 0.4 /100 | #259 | Tragic $91,848 |
| Pennsylvania Germans | 0.4 /100 | #260 | Tragic $91,763 |
| Inupiat | 0.4 /100 | #261 | Tragic $91,730 |
| Liberians | 0.4 /100 | #262 | Tragic $91,722 |
| Immigrants | West Indies | 0.3 /100 | #263 | Tragic $91,588 |
| Senegalese | 0.3 /100 | #264 | Tragic $91,475 |