American vs Aleut Median Family Income
COMPARE
American
Aleut
Median Family Income
Median Family Income Comparison
Americans
Aleuts
$92,096
MEDIAN FAMILY INCOME
0.4/ 100
METRIC RATING
257th/ 347
METRIC RANK
$98,702
MEDIAN FAMILY INCOME
11.6/ 100
METRIC RATING
207th/ 347
METRIC RANK
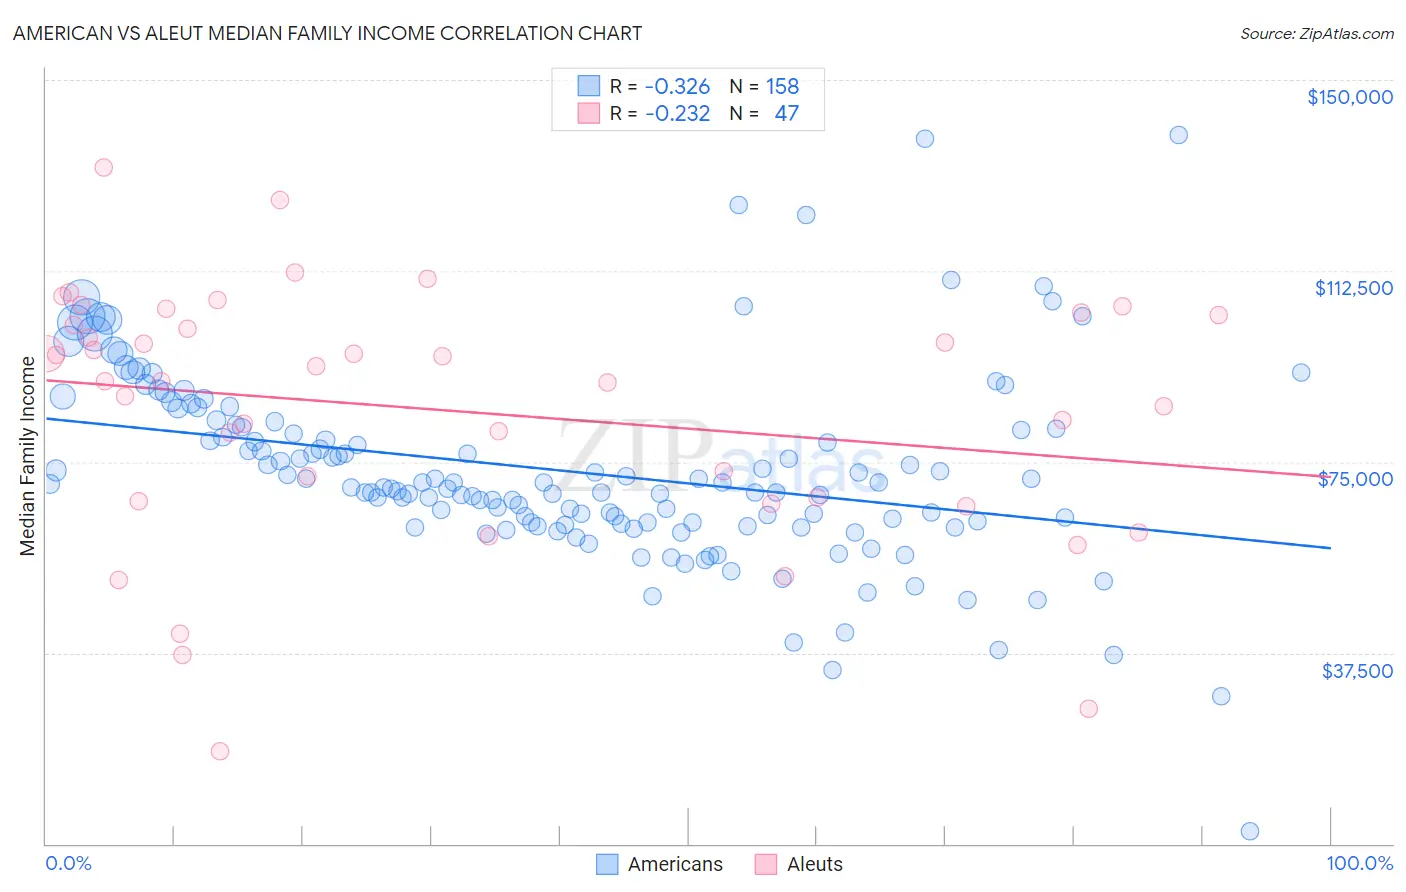
American vs Aleut Median Family Income Correlation Chart
The statistical analysis conducted on geographies consisting of 580,248,843 people shows a mild negative correlation between the proportion of Americans and median family income in the United States with a correlation coefficient (R) of -0.326 and weighted average of $92,096. Similarly, the statistical analysis conducted on geographies consisting of 61,771,380 people shows a weak negative correlation between the proportion of Aleuts and median family income in the United States with a correlation coefficient (R) of -0.232 and weighted average of $98,702, a difference of 7.2%.
Median Family Income Correlation Summary
| Measurement | American | Aleut |
| Minimum | $2,499 | $18,125 |
| Maximum | $139,235 | $132,750 |
| Range | $136,736 | $114,625 |
| Mean | $73,235 | $85,071 |
| Median | $70,309 | $90,875 |
| Interquartile 25% (IQ1) | $63,060 | $67,198 |
| Interquartile 75% (IQ3) | $81,871 | $103,750 |
| Interquartile Range (IQR) | $18,811 | $36,552 |
| Standard Deviation (Sample) | $18,957 | $24,932 |
| Standard Deviation (Population) | $18,897 | $24,665 |
Similar Demographics by Median Family Income
Demographics Similar to Americans by Median Family Income
In terms of median family income, the demographic groups most similar to Americans are Nicaraguan ($92,231, a difference of 0.15%), Immigrants from Laos ($92,239, a difference of 0.16%), Osage ($91,926, a difference of 0.19%), Cape Verdean ($91,848, a difference of 0.27%), and Immigrants from Barbados ($92,419, a difference of 0.35%).
| Demographics | Rating | Rank | Median Family Income |
| West Indians | 0.6 /100 | #250 | Tragic $92,765 |
| Immigrants | Somalia | 0.6 /100 | #251 | Tragic $92,609 |
| Immigrants | El Salvador | 0.6 /100 | #252 | Tragic $92,545 |
| Immigrants | Guyana | 0.6 /100 | #253 | Tragic $92,513 |
| Immigrants | Barbados | 0.5 /100 | #254 | Tragic $92,419 |
| Immigrants | Laos | 0.5 /100 | #255 | Tragic $92,239 |
| Nicaraguans | 0.5 /100 | #256 | Tragic $92,231 |
| Americans | 0.4 /100 | #257 | Tragic $92,096 |
| Osage | 0.4 /100 | #258 | Tragic $91,926 |
| Cape Verdeans | 0.4 /100 | #259 | Tragic $91,848 |
| Pennsylvania Germans | 0.4 /100 | #260 | Tragic $91,763 |
| Inupiat | 0.4 /100 | #261 | Tragic $91,730 |
| Liberians | 0.4 /100 | #262 | Tragic $91,722 |
| Immigrants | West Indies | 0.3 /100 | #263 | Tragic $91,588 |
| Senegalese | 0.3 /100 | #264 | Tragic $91,475 |
Demographics Similar to Aleuts by Median Family Income
In terms of median family income, the demographic groups most similar to Aleuts are Immigrants from Iraq ($98,786, a difference of 0.080%), Hawaiian ($98,869, a difference of 0.17%), Ghanaian ($98,877, a difference of 0.18%), Immigrants from Uruguay ($98,205, a difference of 0.51%), and Immigrants from Colombia ($98,067, a difference of 0.65%).
| Demographics | Rating | Rank | Median Family Income |
| Spanish | 20.1 /100 | #200 | Fair $99,977 |
| Immigrants | Thailand | 19.0 /100 | #201 | Poor $99,840 |
| Whites/Caucasians | 18.7 /100 | #202 | Poor $99,800 |
| Scotch-Irish | 17.1 /100 | #203 | Poor $99,591 |
| Ghanaians | 12.6 /100 | #204 | Poor $98,877 |
| Hawaiians | 12.5 /100 | #205 | Poor $98,869 |
| Immigrants | Iraq | 12.1 /100 | #206 | Poor $98,786 |
| Aleuts | 11.6 /100 | #207 | Poor $98,702 |
| Immigrants | Uruguay | 9.2 /100 | #208 | Tragic $98,205 |
| Immigrants | Colombia | 8.7 /100 | #209 | Tragic $98,067 |
| Puget Sound Salish | 8.2 /100 | #210 | Tragic $97,958 |
| Immigrants | Sudan | 7.4 /100 | #211 | Tragic $97,737 |
| Panamanians | 7.2 /100 | #212 | Tragic $97,683 |
| Immigrants | Armenia | 7.0 /100 | #213 | Tragic $97,605 |
| Bermudans | 6.9 /100 | #214 | Tragic $97,577 |