American vs Delaware Median Family Income
COMPARE
American
Delaware
Median Family Income
Median Family Income Comparison
Americans
Delaware
$92,096
MEDIAN FAMILY INCOME
0.4/ 100
METRIC RATING
257th/ 347
METRIC RANK
$96,958
MEDIAN FAMILY INCOME
5.1/ 100
METRIC RATING
219th/ 347
METRIC RANK
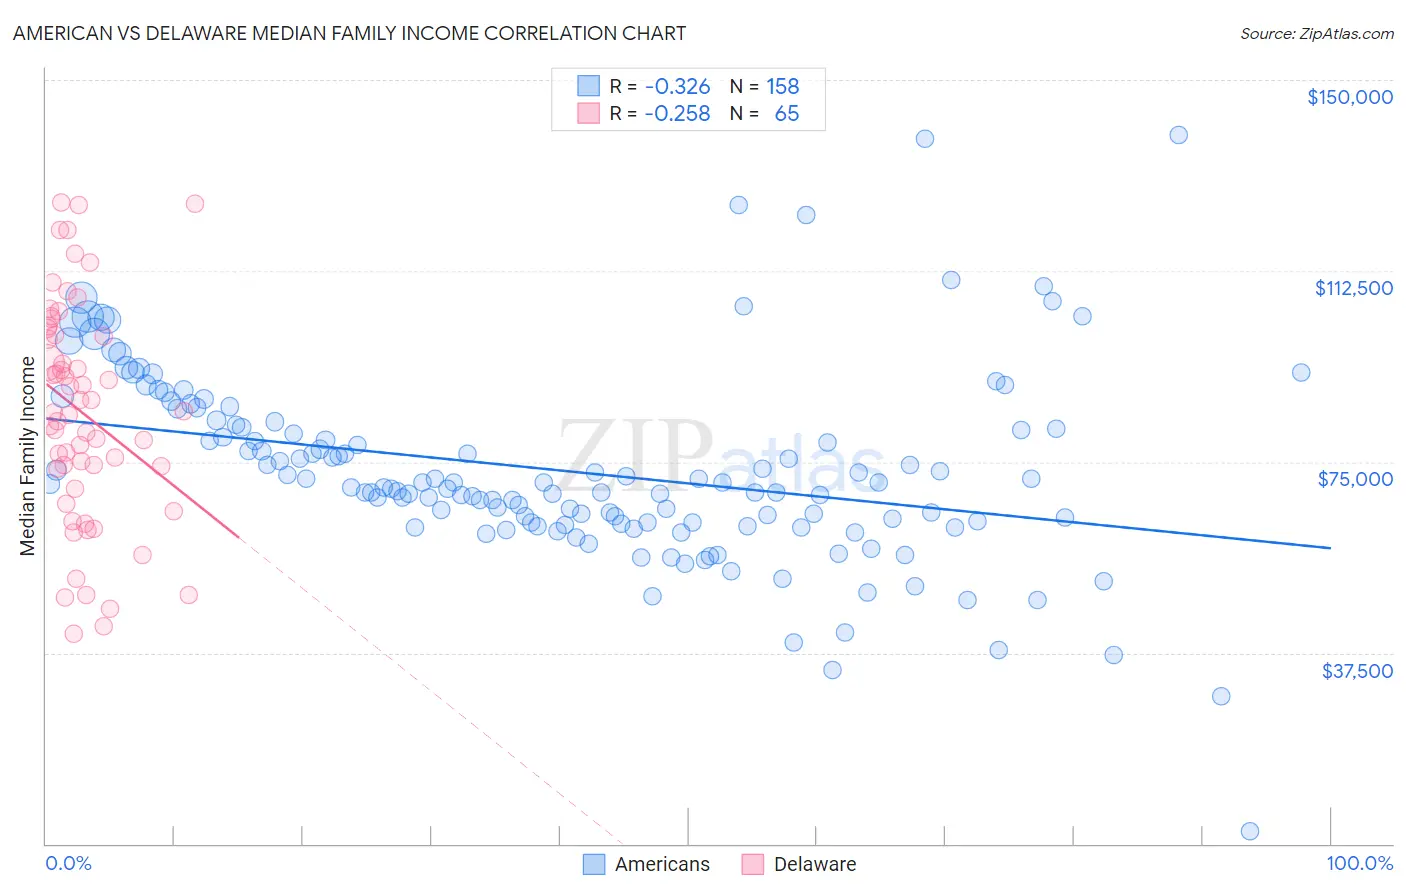
American vs Delaware Median Family Income Correlation Chart
The statistical analysis conducted on geographies consisting of 580,248,843 people shows a mild negative correlation between the proportion of Americans and median family income in the United States with a correlation coefficient (R) of -0.326 and weighted average of $92,096. Similarly, the statistical analysis conducted on geographies consisting of 96,215,498 people shows a weak negative correlation between the proportion of Delaware and median family income in the United States with a correlation coefficient (R) of -0.258 and weighted average of $96,958, a difference of 5.3%.
Median Family Income Correlation Summary
| Measurement | American | Delaware |
| Minimum | $2,499 | $41,165 |
| Maximum | $139,235 | $125,926 |
| Range | $136,736 | $84,761 |
| Mean | $73,235 | $84,700 |
| Median | $70,309 | $84,783 |
| Interquartile 25% (IQ1) | $63,060 | $71,717 |
| Interquartile 75% (IQ3) | $81,871 | $100,612 |
| Interquartile Range (IQR) | $18,811 | $28,895 |
| Standard Deviation (Sample) | $18,957 | $21,556 |
| Standard Deviation (Population) | $18,897 | $21,389 |
Similar Demographics by Median Family Income
Demographics Similar to Americans by Median Family Income
In terms of median family income, the demographic groups most similar to Americans are Nicaraguan ($92,231, a difference of 0.15%), Immigrants from Laos ($92,239, a difference of 0.16%), Osage ($91,926, a difference of 0.19%), Cape Verdean ($91,848, a difference of 0.27%), and Immigrants from Barbados ($92,419, a difference of 0.35%).
| Demographics | Rating | Rank | Median Family Income |
| West Indians | 0.6 /100 | #250 | Tragic $92,765 |
| Immigrants | Somalia | 0.6 /100 | #251 | Tragic $92,609 |
| Immigrants | El Salvador | 0.6 /100 | #252 | Tragic $92,545 |
| Immigrants | Guyana | 0.6 /100 | #253 | Tragic $92,513 |
| Immigrants | Barbados | 0.5 /100 | #254 | Tragic $92,419 |
| Immigrants | Laos | 0.5 /100 | #255 | Tragic $92,239 |
| Nicaraguans | 0.5 /100 | #256 | Tragic $92,231 |
| Americans | 0.4 /100 | #257 | Tragic $92,096 |
| Osage | 0.4 /100 | #258 | Tragic $91,926 |
| Cape Verdeans | 0.4 /100 | #259 | Tragic $91,848 |
| Pennsylvania Germans | 0.4 /100 | #260 | Tragic $91,763 |
| Inupiat | 0.4 /100 | #261 | Tragic $91,730 |
| Liberians | 0.4 /100 | #262 | Tragic $91,722 |
| Immigrants | West Indies | 0.3 /100 | #263 | Tragic $91,588 |
| Senegalese | 0.3 /100 | #264 | Tragic $91,475 |
Demographics Similar to Delaware by Median Family Income
In terms of median family income, the demographic groups most similar to Delaware are Sudanese ($96,783, a difference of 0.18%), Immigrants from Cambodia ($97,222, a difference of 0.27%), Japanese ($97,288, a difference of 0.34%), Immigrants from Ghana ($96,544, a difference of 0.43%), and Immigrants from Bosnia and Herzegovina ($97,432, a difference of 0.49%).
| Demographics | Rating | Rank | Median Family Income |
| Panamanians | 7.2 /100 | #212 | Tragic $97,683 |
| Immigrants | Armenia | 7.0 /100 | #213 | Tragic $97,605 |
| Bermudans | 6.9 /100 | #214 | Tragic $97,577 |
| Nigerians | 6.7 /100 | #215 | Tragic $97,522 |
| Immigrants | Bosnia and Herzegovina | 6.4 /100 | #216 | Tragic $97,432 |
| Japanese | 6.0 /100 | #217 | Tragic $97,288 |
| Immigrants | Cambodia | 5.8 /100 | #218 | Tragic $97,222 |
| Delaware | 5.1 /100 | #219 | Tragic $96,958 |
| Sudanese | 4.7 /100 | #220 | Tragic $96,783 |
| Immigrants | Ghana | 4.2 /100 | #221 | Tragic $96,544 |
| Immigrants | Nigeria | 4.0 /100 | #222 | Tragic $96,439 |
| Venezuelans | 3.7 /100 | #223 | Tragic $96,281 |
| Immigrants | Nonimmigrants | 3.6 /100 | #224 | Tragic $96,231 |
| Vietnamese | 3.4 /100 | #225 | Tragic $96,123 |
| Immigrants | Panama | 2.7 /100 | #226 | Tragic $95,647 |