Ghanaian vs Irish Median Family Income
COMPARE
Ghanaian
Irish
Median Family Income
Median Family Income Comparison
Ghanaians
Irish
$98,877
MEDIAN FAMILY INCOME
12.6/ 100
METRIC RATING
204th/ 347
METRIC RANK
$105,453
MEDIAN FAMILY INCOME
80.5/ 100
METRIC RATING
150th/ 347
METRIC RANK
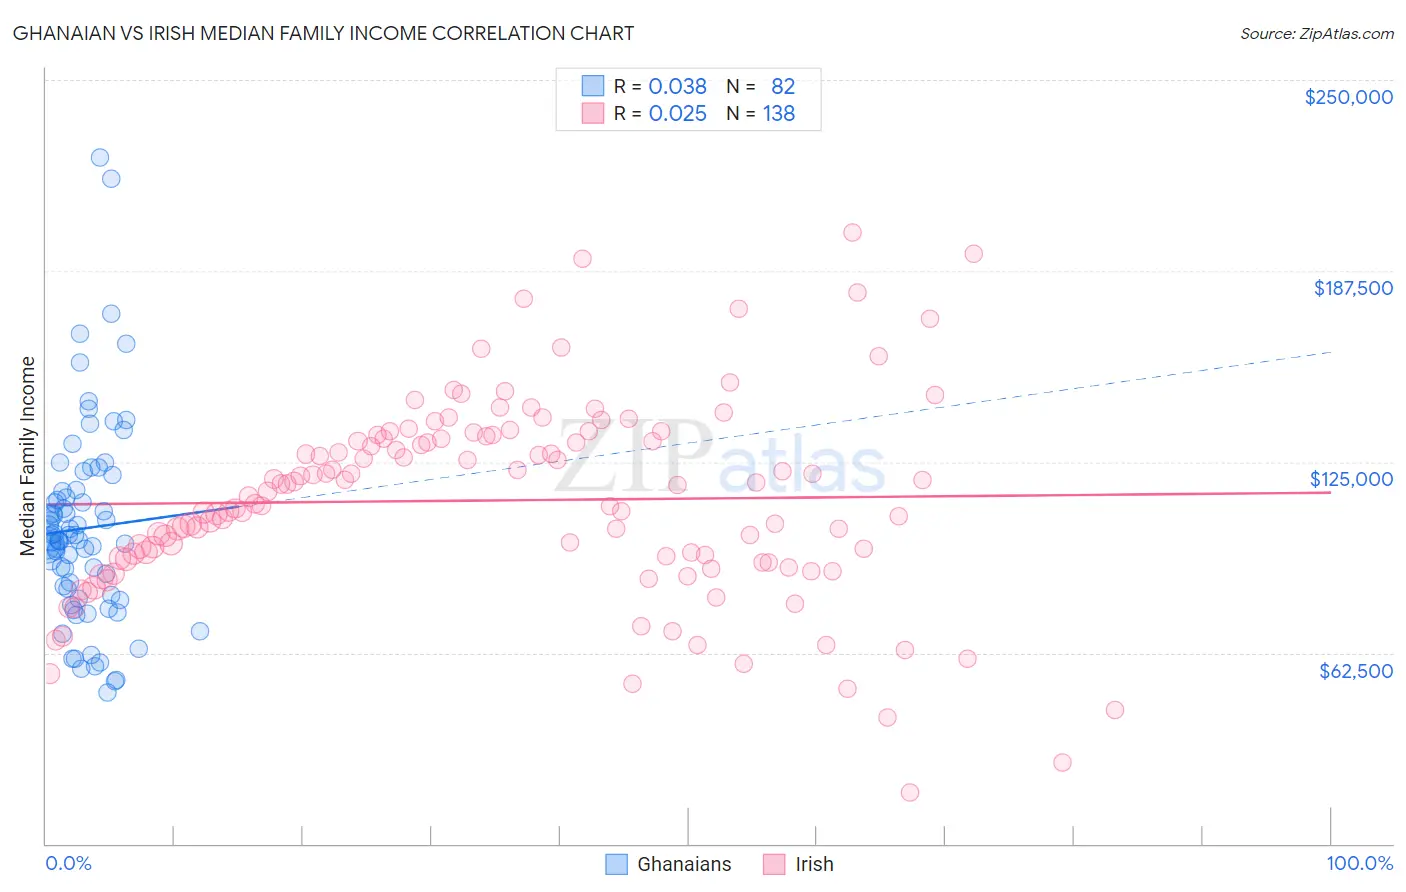
Ghanaian vs Irish Median Family Income Correlation Chart
The statistical analysis conducted on geographies consisting of 190,476,468 people shows no correlation between the proportion of Ghanaians and median family income in the United States with a correlation coefficient (R) of 0.038 and weighted average of $98,877. Similarly, the statistical analysis conducted on geographies consisting of 578,674,482 people shows no correlation between the proportion of Irish and median family income in the United States with a correlation coefficient (R) of 0.025 and weighted average of $105,453, a difference of 6.7%.
Median Family Income Correlation Summary
| Measurement | Ghanaian | Irish |
| Minimum | $49,625 | $16,721 |
| Maximum | $224,545 | $200,267 |
| Range | $174,920 | $183,546 |
| Mean | $103,158 | $112,390 |
| Median | $99,461 | $114,410 |
| Interquartile 25% (IQ1) | $81,320 | $93,102 |
| Interquartile 75% (IQ3) | $115,481 | $132,553 |
| Interquartile Range (IQR) | $34,161 | $39,451 |
| Standard Deviation (Sample) | $32,730 | $32,421 |
| Standard Deviation (Population) | $32,529 | $32,303 |
Similar Demographics by Median Family Income
Demographics Similar to Ghanaians by Median Family Income
In terms of median family income, the demographic groups most similar to Ghanaians are Hawaiian ($98,869, a difference of 0.010%), Immigrants from Iraq ($98,786, a difference of 0.090%), Aleut ($98,702, a difference of 0.18%), Immigrants from Uruguay ($98,205, a difference of 0.68%), and Scotch-Irish ($99,591, a difference of 0.72%).
| Demographics | Rating | Rank | Median Family Income |
| Immigrants | Cameroon | 22.8 /100 | #197 | Fair $100,289 |
| Immigrants | Africa | 22.5 /100 | #198 | Fair $100,256 |
| Yugoslavians | 21.3 /100 | #199 | Fair $100,119 |
| Spanish | 20.1 /100 | #200 | Fair $99,977 |
| Immigrants | Thailand | 19.0 /100 | #201 | Poor $99,840 |
| Whites/Caucasians | 18.7 /100 | #202 | Poor $99,800 |
| Scotch-Irish | 17.1 /100 | #203 | Poor $99,591 |
| Ghanaians | 12.6 /100 | #204 | Poor $98,877 |
| Hawaiians | 12.5 /100 | #205 | Poor $98,869 |
| Immigrants | Iraq | 12.1 /100 | #206 | Poor $98,786 |
| Aleuts | 11.6 /100 | #207 | Poor $98,702 |
| Immigrants | Uruguay | 9.2 /100 | #208 | Tragic $98,205 |
| Immigrants | Colombia | 8.7 /100 | #209 | Tragic $98,067 |
| Puget Sound Salish | 8.2 /100 | #210 | Tragic $97,958 |
| Immigrants | Sudan | 7.4 /100 | #211 | Tragic $97,737 |
Demographics Similar to Irish by Median Family Income
In terms of median family income, the demographic groups most similar to Irish are Peruvian ($105,444, a difference of 0.010%), Immigrants from Germany ($105,507, a difference of 0.050%), Hungarian ($105,609, a difference of 0.15%), Immigrants from Albania ($105,285, a difference of 0.16%), and Immigrants from Chile ($105,655, a difference of 0.19%).
| Demographics | Rating | Rank | Median Family Income |
| Tongans | 84.3 /100 | #143 | Excellent $105,967 |
| Immigrants | Morocco | 84.3 /100 | #144 | Excellent $105,964 |
| Danes | 83.8 /100 | #145 | Excellent $105,900 |
| Czechs | 83.4 /100 | #146 | Excellent $105,839 |
| Immigrants | Chile | 82.1 /100 | #147 | Excellent $105,655 |
| Hungarians | 81.7 /100 | #148 | Excellent $105,609 |
| Immigrants | Germany | 80.9 /100 | #149 | Excellent $105,507 |
| Irish | 80.5 /100 | #150 | Excellent $105,453 |
| Peruvians | 80.4 /100 | #151 | Excellent $105,444 |
| Immigrants | Albania | 79.1 /100 | #152 | Good $105,285 |
| Slavs | 77.9 /100 | #153 | Good $105,144 |
| Immigrants | Nepal | 76.3 /100 | #154 | Good $104,966 |
| Native Hawaiians | 75.8 /100 | #155 | Good $104,910 |
| Basques | 74.4 /100 | #156 | Good $104,760 |
| Moroccans | 71.6 /100 | #157 | Good $104,488 |