Menominee vs Irish Median Family Income
COMPARE
Menominee
Irish
Median Family Income
Median Family Income Comparison
Menominee
Irish
$79,563
MEDIAN FAMILY INCOME
0.0/ 100
METRIC RATING
334th/ 347
METRIC RANK
$105,453
MEDIAN FAMILY INCOME
80.5/ 100
METRIC RATING
150th/ 347
METRIC RANK
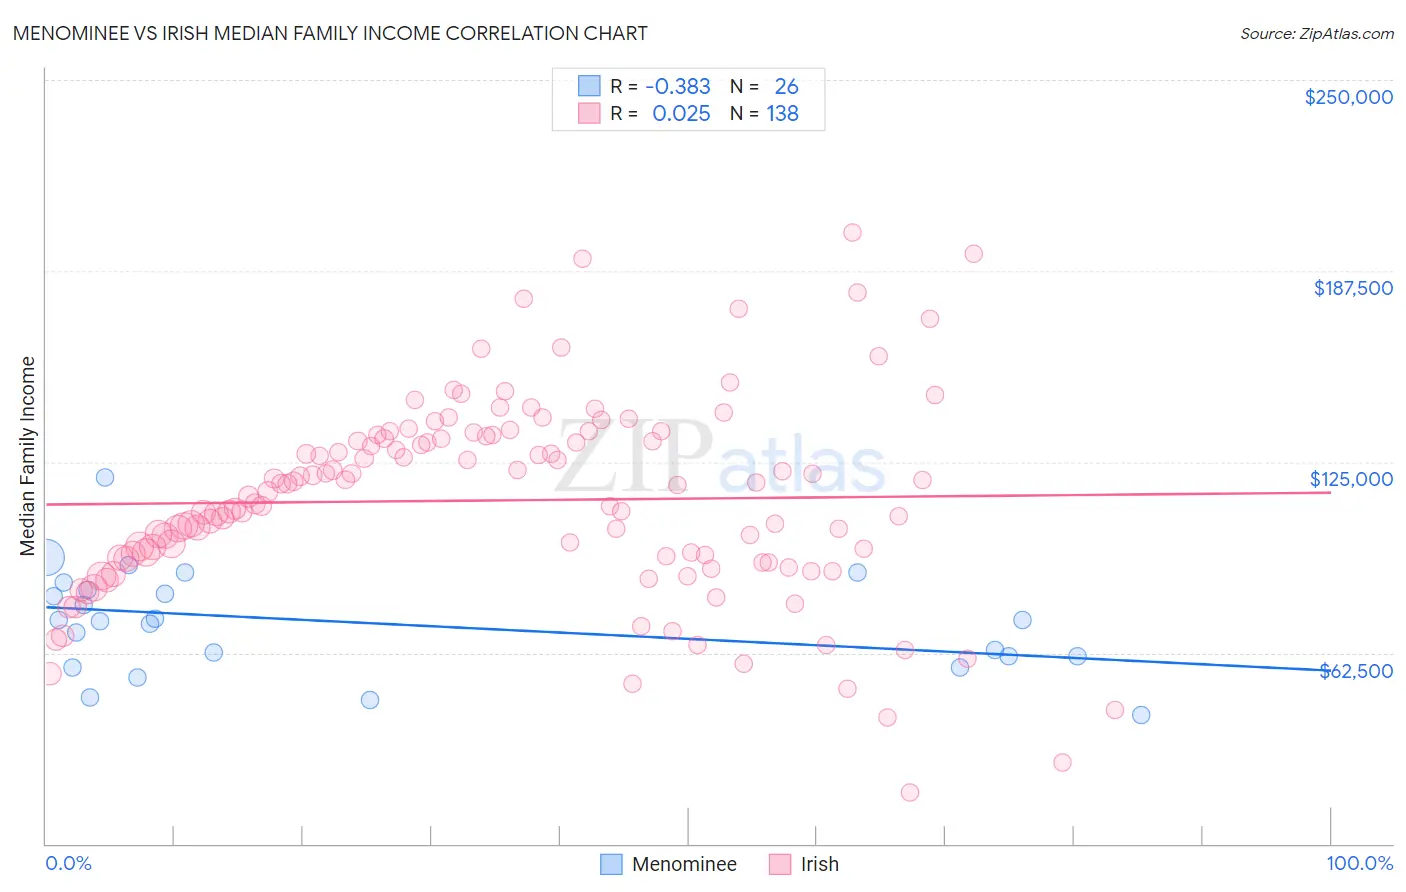
Menominee vs Irish Median Family Income Correlation Chart
The statistical analysis conducted on geographies consisting of 45,777,534 people shows a mild negative correlation between the proportion of Menominee and median family income in the United States with a correlation coefficient (R) of -0.383 and weighted average of $79,563. Similarly, the statistical analysis conducted on geographies consisting of 578,674,482 people shows no correlation between the proportion of Irish and median family income in the United States with a correlation coefficient (R) of 0.025 and weighted average of $105,453, a difference of 32.5%.
Median Family Income Correlation Summary
| Measurement | Menominee | Irish |
| Minimum | $41,944 | $16,721 |
| Maximum | $119,750 | $200,267 |
| Range | $77,806 | $183,546 |
| Mean | $72,340 | $112,390 |
| Median | $72,940 | $114,410 |
| Interquartile 25% (IQ1) | $61,250 | $93,102 |
| Interquartile 75% (IQ3) | $83,264 | $132,553 |
| Interquartile Range (IQR) | $22,014 | $39,451 |
| Standard Deviation (Sample) | $17,229 | $32,421 |
| Standard Deviation (Population) | $16,895 | $32,303 |
Similar Demographics by Median Family Income
Demographics Similar to Menominee by Median Family Income
In terms of median family income, the demographic groups most similar to Menominee are Yup'ik ($79,290, a difference of 0.34%), Kiowa ($80,885, a difference of 1.7%), Immigrants from Cuba ($78,249, a difference of 1.7%), Native/Alaskan ($80,908, a difference of 1.7%), and Yuman ($78,055, a difference of 1.9%).
| Demographics | Rating | Rank | Median Family Income |
| Arapaho | 0.0 /100 | #327 | Tragic $82,064 |
| Blacks/African Americans | 0.0 /100 | #328 | Tragic $81,912 |
| Dutch West Indians | 0.0 /100 | #329 | Tragic $81,852 |
| Cheyenne | 0.0 /100 | #330 | Tragic $81,385 |
| Immigrants | Dominican Republic | 0.0 /100 | #331 | Tragic $81,233 |
| Natives/Alaskans | 0.0 /100 | #332 | Tragic $80,908 |
| Kiowa | 0.0 /100 | #333 | Tragic $80,885 |
| Menominee | 0.0 /100 | #334 | Tragic $79,563 |
| Yup'ik | 0.0 /100 | #335 | Tragic $79,290 |
| Immigrants | Cuba | 0.0 /100 | #336 | Tragic $78,249 |
| Yuman | 0.0 /100 | #337 | Tragic $78,055 |
| Immigrants | Yemen | 0.0 /100 | #338 | Tragic $77,457 |
| Pima | 0.0 /100 | #339 | Tragic $77,431 |
| Hopi | 0.0 /100 | #340 | Tragic $77,188 |
| Pueblo | 0.0 /100 | #341 | Tragic $76,880 |
Demographics Similar to Irish by Median Family Income
In terms of median family income, the demographic groups most similar to Irish are Peruvian ($105,444, a difference of 0.010%), Immigrants from Germany ($105,507, a difference of 0.050%), Hungarian ($105,609, a difference of 0.15%), Immigrants from Albania ($105,285, a difference of 0.16%), and Immigrants from Chile ($105,655, a difference of 0.19%).
| Demographics | Rating | Rank | Median Family Income |
| Tongans | 84.3 /100 | #143 | Excellent $105,967 |
| Immigrants | Morocco | 84.3 /100 | #144 | Excellent $105,964 |
| Danes | 83.8 /100 | #145 | Excellent $105,900 |
| Czechs | 83.4 /100 | #146 | Excellent $105,839 |
| Immigrants | Chile | 82.1 /100 | #147 | Excellent $105,655 |
| Hungarians | 81.7 /100 | #148 | Excellent $105,609 |
| Immigrants | Germany | 80.9 /100 | #149 | Excellent $105,507 |
| Irish | 80.5 /100 | #150 | Excellent $105,453 |
| Peruvians | 80.4 /100 | #151 | Excellent $105,444 |
| Immigrants | Albania | 79.1 /100 | #152 | Good $105,285 |
| Slavs | 77.9 /100 | #153 | Good $105,144 |
| Immigrants | Nepal | 76.3 /100 | #154 | Good $104,966 |
| Native Hawaiians | 75.8 /100 | #155 | Good $104,910 |
| Basques | 74.4 /100 | #156 | Good $104,760 |
| Moroccans | 71.6 /100 | #157 | Good $104,488 |