Immigrants from Uganda vs Irish Median Family Income
COMPARE
Immigrants from Uganda
Irish
Median Family Income
Median Family Income Comparison
Immigrants from Uganda
Irish
$106,188
MEDIAN FAMILY INCOME
85.7/ 100
METRIC RATING
137th/ 347
METRIC RANK
$105,453
MEDIAN FAMILY INCOME
80.5/ 100
METRIC RATING
150th/ 347
METRIC RANK
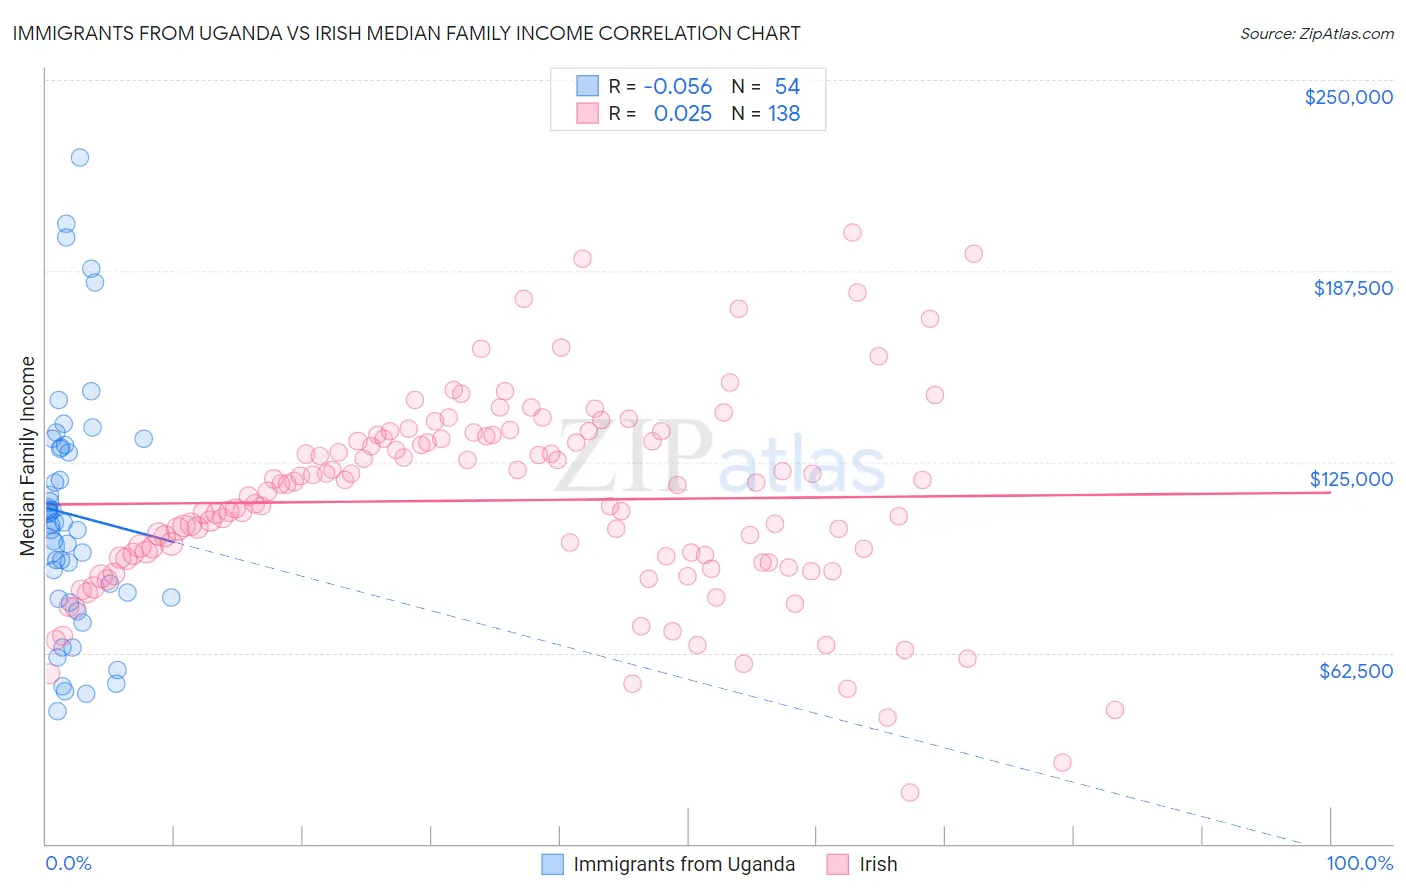
Immigrants from Uganda vs Irish Median Family Income Correlation Chart
The statistical analysis conducted on geographies consisting of 125,960,521 people shows a slight negative correlation between the proportion of Immigrants from Uganda and median family income in the United States with a correlation coefficient (R) of -0.056 and weighted average of $106,188. Similarly, the statistical analysis conducted on geographies consisting of 578,674,482 people shows no correlation between the proportion of Irish and median family income in the United States with a correlation coefficient (R) of 0.025 and weighted average of $105,453, a difference of 0.70%.
Median Family Income Correlation Summary
| Measurement | Immigrants from Uganda | Irish |
| Minimum | $43,204 | $16,721 |
| Maximum | $224,567 | $200,267 |
| Range | $181,363 | $183,546 |
| Mean | $107,720 | $112,390 |
| Median | $104,727 | $114,410 |
| Interquartile 25% (IQ1) | $80,714 | $93,102 |
| Interquartile 75% (IQ3) | $129,701 | $132,553 |
| Interquartile Range (IQR) | $48,987 | $39,451 |
| Standard Deviation (Sample) | $40,035 | $32,421 |
| Standard Deviation (Population) | $39,663 | $32,303 |
Demographics Similar to Immigrants from Uganda and Irish by Median Family Income
In terms of median family income, the demographic groups most similar to Immigrants from Uganda are Immigrants from Vietnam ($106,186, a difference of 0.0%), Luxembourger ($106,183, a difference of 0.0%), Norwegian ($106,144, a difference of 0.040%), Immigrants from South Eastern Asia ($106,252, a difference of 0.060%), and Immigrants from Syria ($106,118, a difference of 0.070%). Similarly, the demographic groups most similar to Irish are Peruvian ($105,444, a difference of 0.010%), Immigrants from Germany ($105,507, a difference of 0.050%), Hungarian ($105,609, a difference of 0.15%), Immigrants from Albania ($105,285, a difference of 0.16%), and Immigrants from Chile ($105,655, a difference of 0.19%).
| Demographics | Rating | Rank | Median Family Income |
| Ugandans | 87.8 /100 | #133 | Excellent $106,541 |
| Immigrants | Oceania | 87.3 /100 | #134 | Excellent $106,453 |
| Portuguese | 86.3 /100 | #135 | Excellent $106,286 |
| Immigrants | South Eastern Asia | 86.1 /100 | #136 | Excellent $106,252 |
| Immigrants | Uganda | 85.7 /100 | #137 | Excellent $106,188 |
| Immigrants | Vietnam | 85.7 /100 | #138 | Excellent $106,186 |
| Luxembourgers | 85.7 /100 | #139 | Excellent $106,183 |
| Norwegians | 85.5 /100 | #140 | Excellent $106,144 |
| Immigrants | Syria | 85.3 /100 | #141 | Excellent $106,118 |
| Slovenes | 84.7 /100 | #142 | Excellent $106,020 |
| Tongans | 84.3 /100 | #143 | Excellent $105,967 |
| Immigrants | Morocco | 84.3 /100 | #144 | Excellent $105,964 |
| Danes | 83.8 /100 | #145 | Excellent $105,900 |
| Czechs | 83.4 /100 | #146 | Excellent $105,839 |
| Immigrants | Chile | 82.1 /100 | #147 | Excellent $105,655 |
| Hungarians | 81.7 /100 | #148 | Excellent $105,609 |
| Immigrants | Germany | 80.9 /100 | #149 | Excellent $105,507 |
| Irish | 80.5 /100 | #150 | Excellent $105,453 |
| Peruvians | 80.4 /100 | #151 | Excellent $105,444 |
| Immigrants | Albania | 79.1 /100 | #152 | Good $105,285 |
| Slavs | 77.9 /100 | #153 | Good $105,144 |