Immigrants from Caribbean vs Immigrants from India Per Capita Income
COMPARE
Immigrants from Caribbean
Immigrants from India
Per Capita Income
Per Capita Income Comparison
Immigrants from Caribbean
Immigrants from India
$37,254
PER CAPITA INCOME
0.1/ 100
METRIC RATING
298th/ 347
METRIC RANK
$55,268
PER CAPITA INCOME
100.0/ 100
METRIC RATING
13th/ 347
METRIC RANK
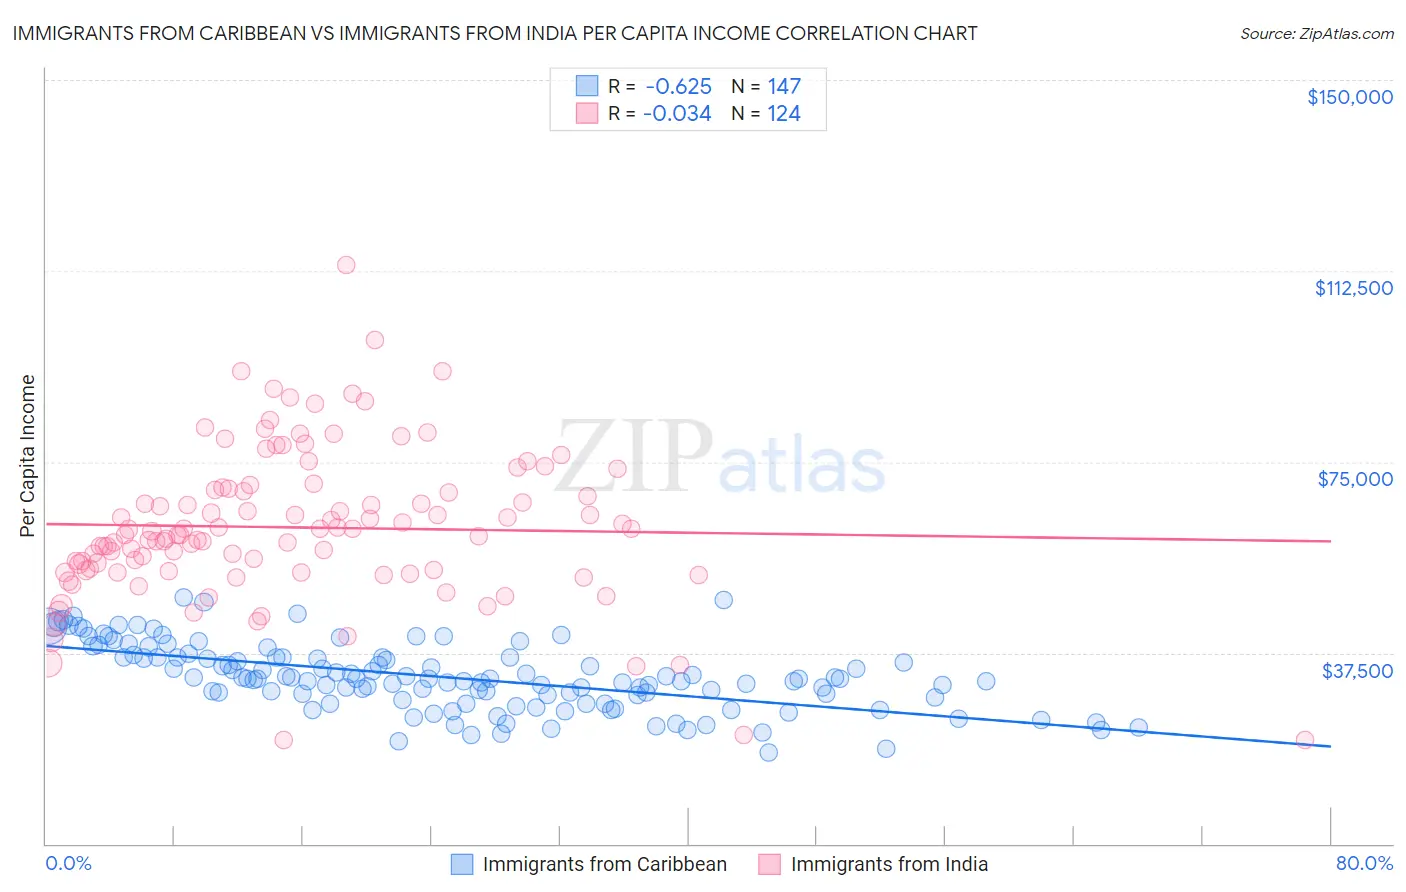
Immigrants from Caribbean vs Immigrants from India Per Capita Income Correlation Chart
The statistical analysis conducted on geographies consisting of 450,065,292 people shows a significant negative correlation between the proportion of Immigrants from Caribbean and per capita income in the United States with a correlation coefficient (R) of -0.625 and weighted average of $37,254. Similarly, the statistical analysis conducted on geographies consisting of 434,146,004 people shows no correlation between the proportion of Immigrants from India and per capita income in the United States with a correlation coefficient (R) of -0.034 and weighted average of $55,268, a difference of 48.3%.
Per Capita Income Correlation Summary
| Measurement | Immigrants from Caribbean | Immigrants from India |
| Minimum | $17,858 | $20,341 |
| Maximum | $48,292 | $113,550 |
| Range | $30,434 | $93,209 |
| Mean | $32,742 | $62,129 |
| Median | $32,401 | $60,635 |
| Interquartile 25% (IQ1) | $28,636 | $53,591 |
| Interquartile 75% (IQ3) | $36,630 | $69,609 |
| Interquartile Range (IQR) | $7,994 | $16,018 |
| Standard Deviation (Sample) | $6,475 | $14,973 |
| Standard Deviation (Population) | $6,453 | $14,913 |
Similar Demographics by Per Capita Income
Demographics Similar to Immigrants from Caribbean by Per Capita Income
In terms of per capita income, the demographic groups most similar to Immigrants from Caribbean are Haitian ($37,289, a difference of 0.090%), Indonesian ($37,300, a difference of 0.12%), Immigrants from Dominican Republic ($37,306, a difference of 0.14%), Cherokee ($37,203, a difference of 0.14%), and Immigrants from Bahamas ($37,193, a difference of 0.17%).
| Demographics | Rating | Rank | Per Capita Income |
| Cajuns | 0.1 /100 | #291 | Tragic $37,527 |
| Immigrants | Micronesia | 0.1 /100 | #292 | Tragic $37,464 |
| Mexican American Indians | 0.1 /100 | #293 | Tragic $37,407 |
| Cubans | 0.1 /100 | #294 | Tragic $37,383 |
| Immigrants | Dominican Republic | 0.1 /100 | #295 | Tragic $37,306 |
| Indonesians | 0.1 /100 | #296 | Tragic $37,300 |
| Haitians | 0.1 /100 | #297 | Tragic $37,289 |
| Immigrants | Caribbean | 0.1 /100 | #298 | Tragic $37,254 |
| Cherokee | 0.1 /100 | #299 | Tragic $37,203 |
| Immigrants | Bahamas | 0.1 /100 | #300 | Tragic $37,193 |
| Ottawa | 0.1 /100 | #301 | Tragic $37,101 |
| Shoshone | 0.1 /100 | #302 | Tragic $37,072 |
| Paiute | 0.1 /100 | #303 | Tragic $37,066 |
| Hondurans | 0.1 /100 | #304 | Tragic $37,031 |
| Inupiat | 0.1 /100 | #305 | Tragic $36,999 |
Demographics Similar to Immigrants from India by Per Capita Income
In terms of per capita income, the demographic groups most similar to Immigrants from India are Immigrants from Belgium ($55,082, a difference of 0.34%), Immigrants from Sweden ($55,582, a difference of 0.57%), Cypriot ($54,899, a difference of 0.67%), Immigrants from Switzerland ($54,866, a difference of 0.73%), and Eastern European ($55,780, a difference of 0.93%).
| Demographics | Rating | Rank | Per Capita Income |
| Immigrants | Taiwan | 100.0 /100 | #6 | Exceptional $57,742 |
| Immigrants | Israel | 100.0 /100 | #7 | Exceptional $57,384 |
| Immigrants | Hong Kong | 100.0 /100 | #8 | Exceptional $56,709 |
| Immigrants | Ireland | 100.0 /100 | #9 | Exceptional $56,584 |
| Okinawans | 100.0 /100 | #10 | Exceptional $55,817 |
| Eastern Europeans | 100.0 /100 | #11 | Exceptional $55,780 |
| Immigrants | Sweden | 100.0 /100 | #12 | Exceptional $55,582 |
| Immigrants | India | 100.0 /100 | #13 | Exceptional $55,268 |
| Immigrants | Belgium | 100.0 /100 | #14 | Exceptional $55,082 |
| Cypriots | 100.0 /100 | #15 | Exceptional $54,899 |
| Immigrants | Switzerland | 100.0 /100 | #16 | Exceptional $54,866 |
| Immigrants | France | 100.0 /100 | #17 | Exceptional $54,557 |
| Thais | 100.0 /100 | #18 | Exceptional $54,307 |
| Immigrants | China | 100.0 /100 | #19 | Exceptional $54,264 |
| Soviet Union | 100.0 /100 | #20 | Exceptional $54,202 |