Immigrants from Japan vs Immigrants from India Per Capita Income
COMPARE
Immigrants from Japan
Immigrants from India
Per Capita Income
Per Capita Income Comparison
Immigrants from Japan
Immigrants from India
$53,359
PER CAPITA INCOME
100.0/ 100
METRIC RATING
25th/ 347
METRIC RANK
$55,268
PER CAPITA INCOME
100.0/ 100
METRIC RATING
13th/ 347
METRIC RANK
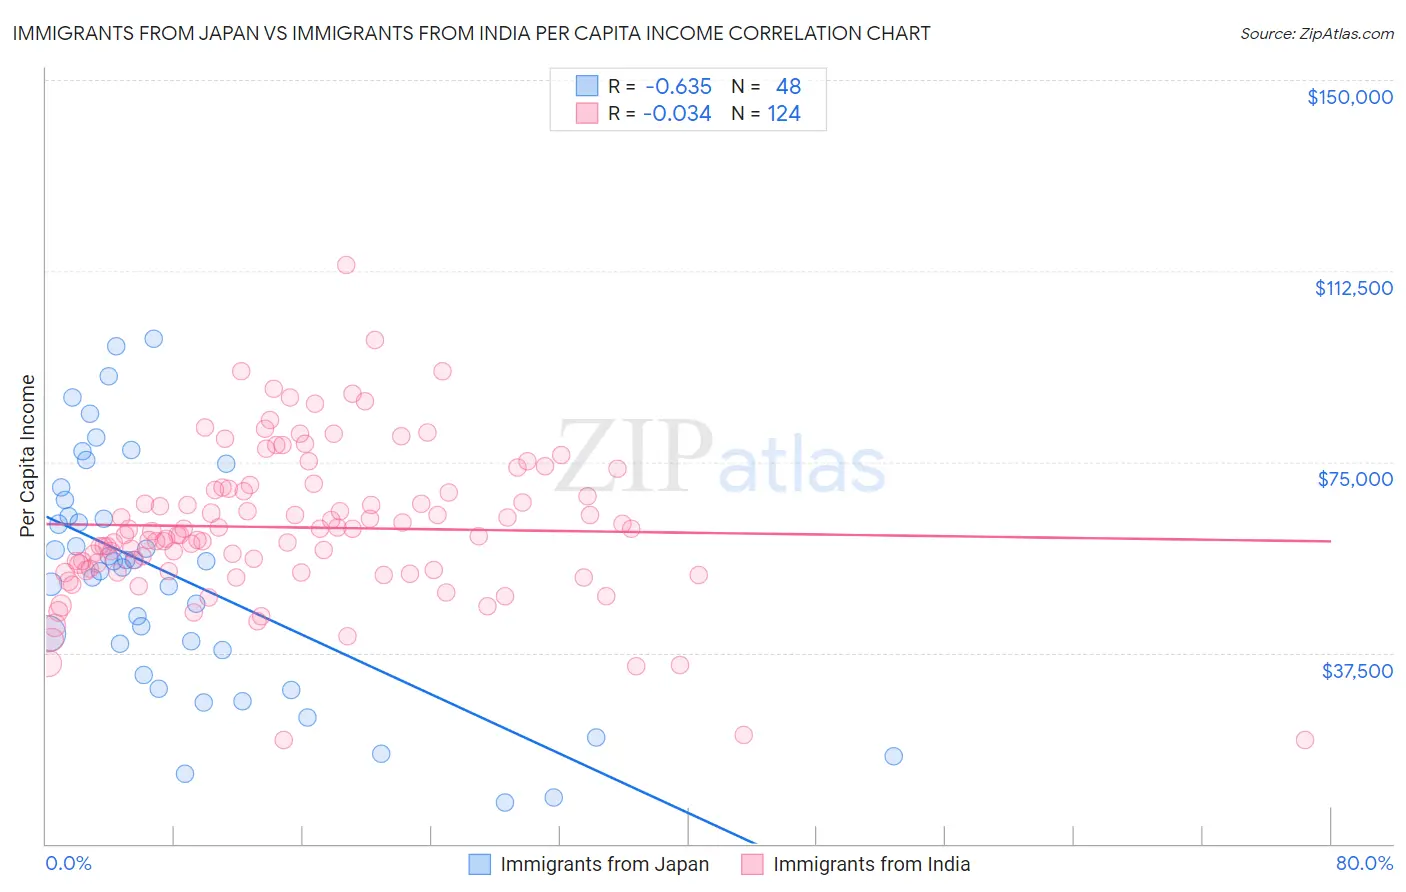
Immigrants from Japan vs Immigrants from India Per Capita Income Correlation Chart
The statistical analysis conducted on geographies consisting of 340,161,368 people shows a significant negative correlation between the proportion of Immigrants from Japan and per capita income in the United States with a correlation coefficient (R) of -0.635 and weighted average of $53,359. Similarly, the statistical analysis conducted on geographies consisting of 434,146,004 people shows no correlation between the proportion of Immigrants from India and per capita income in the United States with a correlation coefficient (R) of -0.034 and weighted average of $55,268, a difference of 3.6%.
Per Capita Income Correlation Summary
| Measurement | Immigrants from Japan | Immigrants from India |
| Minimum | $8,097 | $20,341 |
| Maximum | $99,130 | $113,550 |
| Range | $91,033 | $93,209 |
| Mean | $52,166 | $62,129 |
| Median | $54,914 | $60,635 |
| Interquartile 25% (IQ1) | $35,570 | $53,591 |
| Interquartile 75% (IQ3) | $65,919 | $69,609 |
| Interquartile Range (IQR) | $30,349 | $16,018 |
| Standard Deviation (Sample) | $23,163 | $14,973 |
| Standard Deviation (Population) | $22,920 | $14,913 |
Demographics Similar to Immigrants from Japan and Immigrants from India by Per Capita Income
In terms of per capita income, the demographic groups most similar to Immigrants from Japan are Russian ($53,154, a difference of 0.39%), Immigrants from Denmark ($53,799, a difference of 0.82%), Immigrants from Eastern Asia ($53,806, a difference of 0.84%), Indian (Asian) ($53,874, a difference of 0.97%), and Immigrants from South Central Asia ($52,660, a difference of 1.3%). Similarly, the demographic groups most similar to Immigrants from India are Immigrants from Belgium ($55,082, a difference of 0.34%), Immigrants from Sweden ($55,582, a difference of 0.57%), Cypriot ($54,899, a difference of 0.67%), Immigrants from Switzerland ($54,866, a difference of 0.73%), and Eastern European ($55,780, a difference of 0.93%).
| Demographics | Rating | Rank | Per Capita Income |
| Immigrants | Ireland | 100.0 /100 | #9 | Exceptional $56,584 |
| Okinawans | 100.0 /100 | #10 | Exceptional $55,817 |
| Eastern Europeans | 100.0 /100 | #11 | Exceptional $55,780 |
| Immigrants | Sweden | 100.0 /100 | #12 | Exceptional $55,582 |
| Immigrants | India | 100.0 /100 | #13 | Exceptional $55,268 |
| Immigrants | Belgium | 100.0 /100 | #14 | Exceptional $55,082 |
| Cypriots | 100.0 /100 | #15 | Exceptional $54,899 |
| Immigrants | Switzerland | 100.0 /100 | #16 | Exceptional $54,866 |
| Immigrants | France | 100.0 /100 | #17 | Exceptional $54,557 |
| Thais | 100.0 /100 | #18 | Exceptional $54,307 |
| Immigrants | China | 100.0 /100 | #19 | Exceptional $54,264 |
| Soviet Union | 100.0 /100 | #20 | Exceptional $54,202 |
| Immigrants | Northern Europe | 100.0 /100 | #21 | Exceptional $54,159 |
| Indians (Asian) | 100.0 /100 | #22 | Exceptional $53,874 |
| Immigrants | Eastern Asia | 100.0 /100 | #23 | Exceptional $53,806 |
| Immigrants | Denmark | 100.0 /100 | #24 | Exceptional $53,799 |
| Immigrants | Japan | 100.0 /100 | #25 | Exceptional $53,359 |
| Russians | 100.0 /100 | #26 | Exceptional $53,154 |
| Immigrants | South Central Asia | 100.0 /100 | #27 | Exceptional $52,660 |
| Latvians | 100.0 /100 | #28 | Exceptional $52,649 |
| Israelis | 100.0 /100 | #29 | Exceptional $52,596 |