American vs Immigrants from India GED/Equivalency
COMPARE
American
Immigrants from India
GED/Equivalency
GED/Equivalency Comparison
Americans
Immigrants from India
84.7%
GED/EQUIVALENCY
8.2/ 100
METRIC RATING
220th/ 347
METRIC RANK
89.7%
GED/EQUIVALENCY
100.0/ 100
METRIC RATING
1st/ 347
METRIC RANK
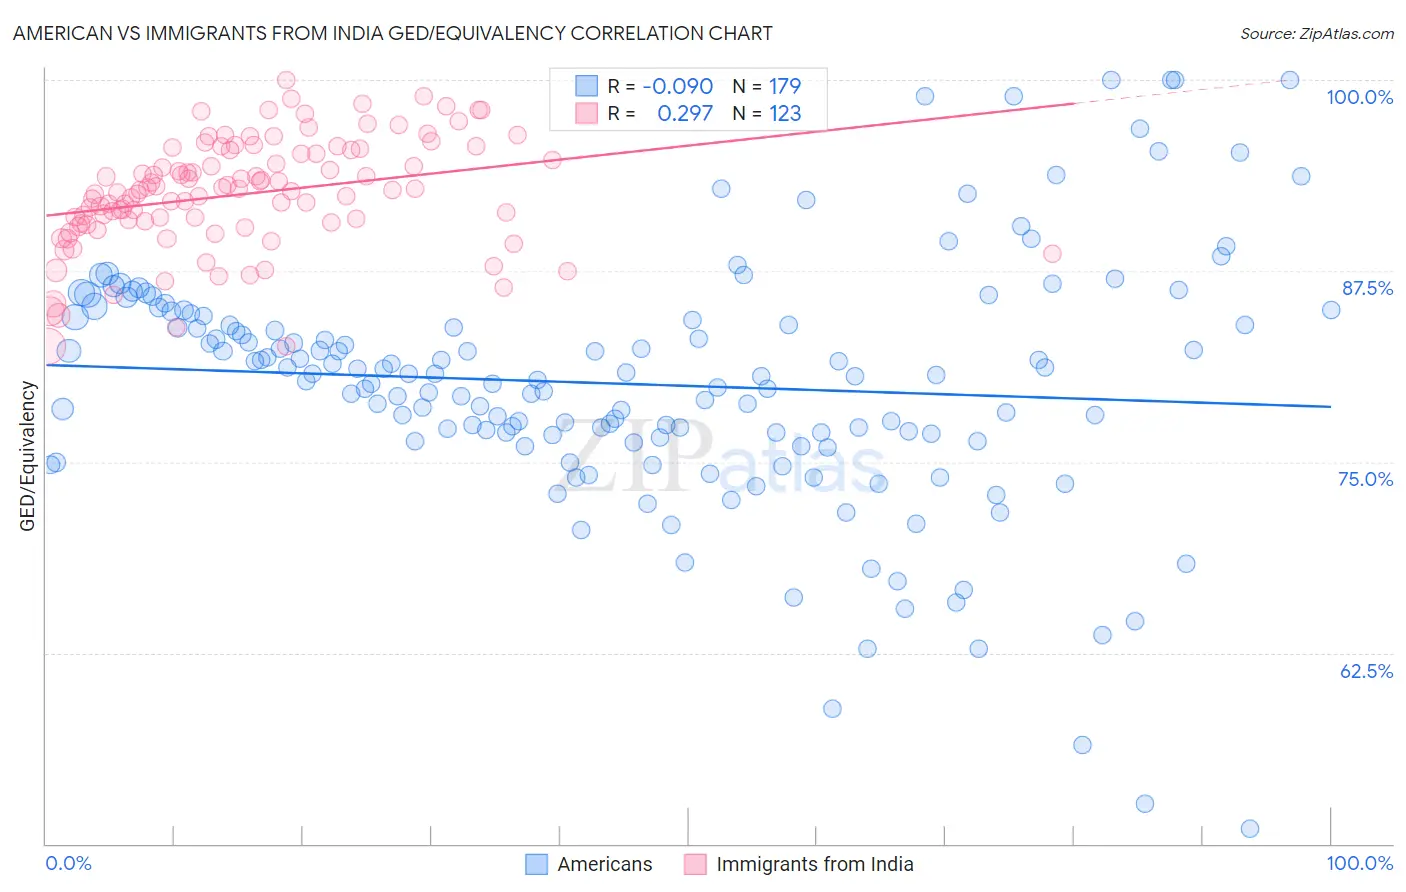
American vs Immigrants from India GED/Equivalency Correlation Chart
The statistical analysis conducted on geographies consisting of 581,992,908 people shows a slight negative correlation between the proportion of Americans and percentage of population with at least ged/equivalency education in the United States with a correlation coefficient (R) of -0.090 and weighted average of 84.7%. Similarly, the statistical analysis conducted on geographies consisting of 434,105,844 people shows a weak positive correlation between the proportion of Immigrants from India and percentage of population with at least ged/equivalency education in the United States with a correlation coefficient (R) of 0.297 and weighted average of 89.7%, a difference of 6.0%.
GED/Equivalency Correlation Summary
| Measurement | American | Immigrants from India |
| Minimum | 51.0% | 82.6% |
| Maximum | 100.0% | 100.0% |
| Range | 49.0% | 17.4% |
| Mean | 80.1% | 92.5% |
| Median | 80.6% | 92.8% |
| Interquartile 25% (IQ1) | 76.6% | 90.6% |
| Interquartile 75% (IQ3) | 84.5% | 95.4% |
| Interquartile Range (IQR) | 7.9% | 4.8% |
| Standard Deviation (Sample) | 8.2% | 3.6% |
| Standard Deviation (Population) | 8.2% | 3.6% |
Similar Demographics by GED/Equivalency
Demographics Similar to Americans by GED/Equivalency
In terms of ged/equivalency, the demographic groups most similar to Americans are Potawatomi (84.7%, a difference of 0.0%), Taiwanese (84.7%, a difference of 0.010%), Immigrants from Micronesia (84.7%, a difference of 0.030%), Nigerian (84.7%, a difference of 0.030%), and Alaska Native (84.7%, a difference of 0.030%).
| Demographics | Rating | Rank | GED/Equivalency |
| Immigrants | Philippines | 10.0 /100 | #213 | Poor 84.8% |
| Osage | 9.5 /100 | #214 | Tragic 84.8% |
| Peruvians | 9.2 /100 | #215 | Tragic 84.7% |
| Immigrants | Micronesia | 8.7 /100 | #216 | Tragic 84.7% |
| Nigerians | 8.6 /100 | #217 | Tragic 84.7% |
| Alaska Natives | 8.6 /100 | #218 | Tragic 84.7% |
| Potawatomi | 8.2 /100 | #219 | Tragic 84.7% |
| Americans | 8.2 /100 | #220 | Tragic 84.7% |
| Taiwanese | 8.1 /100 | #221 | Tragic 84.7% |
| Iroquois | 7.5 /100 | #222 | Tragic 84.6% |
| Immigrants | Uzbekistan | 7.1 /100 | #223 | Tragic 84.6% |
| French American Indians | 6.3 /100 | #224 | Tragic 84.6% |
| Immigrants | Thailand | 5.8 /100 | #225 | Tragic 84.5% |
| Immigrants | Zaire | 5.5 /100 | #226 | Tragic 84.5% |
| Immigrants | Costa Rica | 5.4 /100 | #227 | Tragic 84.5% |
Demographics Similar to Immigrants from India by GED/Equivalency
In terms of ged/equivalency, the demographic groups most similar to Immigrants from India are Filipino (89.5%, a difference of 0.26%), Immigrants from Singapore (89.3%, a difference of 0.47%), Iranian (89.2%, a difference of 0.56%), Latvian (89.2%, a difference of 0.66%), and Thai (89.1%, a difference of 0.68%).
| Demographics | Rating | Rank | GED/Equivalency |
| Immigrants | India | 100.0 /100 | #1 | Exceptional 89.7% |
| Filipinos | 100.0 /100 | #2 | Exceptional 89.5% |
| Immigrants | Singapore | 100.0 /100 | #3 | Exceptional 89.3% |
| Iranians | 100.0 /100 | #4 | Exceptional 89.2% |
| Latvians | 100.0 /100 | #5 | Exceptional 89.2% |
| Thais | 100.0 /100 | #6 | Exceptional 89.1% |
| Eastern Europeans | 99.9 /100 | #7 | Exceptional 89.1% |
| Carpatho Rusyns | 99.9 /100 | #8 | Exceptional 89.1% |
| Chinese | 99.9 /100 | #9 | Exceptional 89.0% |
| Norwegians | 99.9 /100 | #10 | Exceptional 89.0% |
| Bulgarians | 99.9 /100 | #11 | Exceptional 89.0% |
| Lithuanians | 99.9 /100 | #12 | Exceptional 88.9% |
| Immigrants | Iran | 99.9 /100 | #13 | Exceptional 88.9% |
| Cypriots | 99.9 /100 | #14 | Exceptional 88.9% |
| Okinawans | 99.9 /100 | #15 | Exceptional 88.9% |