Alsatian vs Sioux Median Female Earnings
COMPARE
Alsatian
Sioux
Median Female Earnings
Median Female Earnings Comparison
Alsatians
Sioux
$40,060
MEDIAN FEMALE EARNINGS
68.0/ 100
METRIC RATING
161st/ 347
METRIC RANK
$35,063
MEDIAN FEMALE EARNINGS
0.0/ 100
METRIC RATING
307th/ 347
METRIC RANK
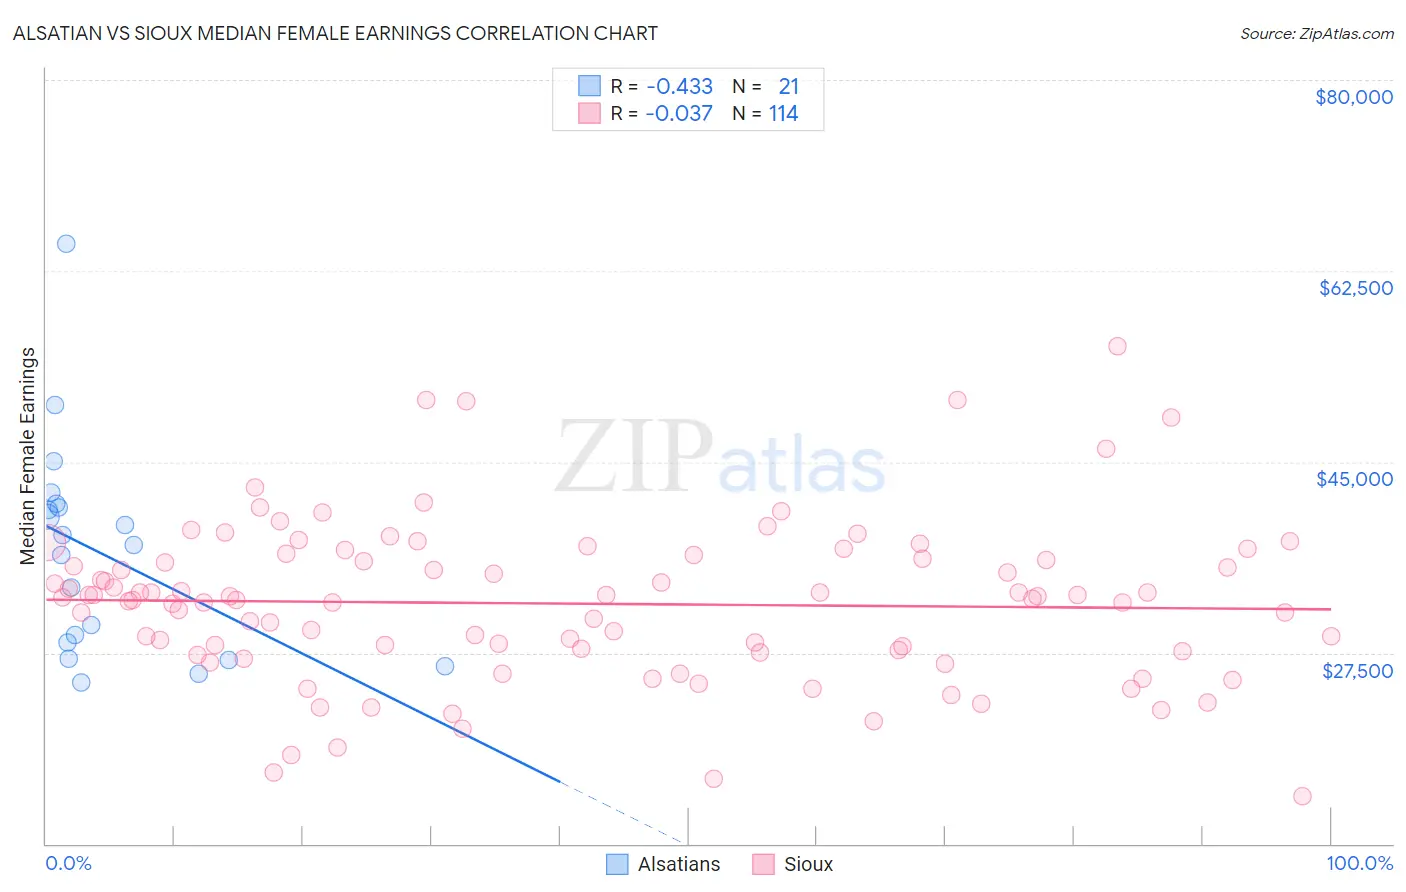
Alsatian vs Sioux Median Female Earnings Correlation Chart
The statistical analysis conducted on geographies consisting of 82,671,266 people shows a moderate negative correlation between the proportion of Alsatians and median female earnings in the United States with a correlation coefficient (R) of -0.433 and weighted average of $40,060. Similarly, the statistical analysis conducted on geographies consisting of 234,051,020 people shows no correlation between the proportion of Sioux and median female earnings in the United States with a correlation coefficient (R) of -0.037 and weighted average of $35,063, a difference of 14.2%.
Median Female Earnings Correlation Summary
| Measurement | Alsatian | Sioux |
| Minimum | $24,833 | $14,387 |
| Maximum | $65,000 | $55,625 |
| Range | $40,167 | $41,238 |
| Mean | $36,577 | $32,005 |
| Median | $37,425 | $32,537 |
| Interquartile 25% (IQ1) | $27,720 | $27,692 |
| Interquartile 75% (IQ3) | $40,989 | $36,094 |
| Interquartile Range (IQR) | $13,268 | $8,402 |
| Standard Deviation (Sample) | $9,753 | $7,319 |
| Standard Deviation (Population) | $9,518 | $7,287 |
Similar Demographics by Median Female Earnings
Demographics Similar to Alsatians by Median Female Earnings
In terms of median female earnings, the demographic groups most similar to Alsatians are Inupiat ($40,080, a difference of 0.050%), South American Indian ($40,019, a difference of 0.10%), Lebanese ($40,006, a difference of 0.14%), Immigrants from Vietnam ($40,153, a difference of 0.23%), and Immigrants from Senegal ($40,157, a difference of 0.24%).
| Demographics | Rating | Rank | Median Female Earnings |
| Immigrants | Oceania | 77.6 /100 | #154 | Good $40,297 |
| Immigrants | Africa | 76.2 /100 | #155 | Good $40,257 |
| Peruvians | 75.3 /100 | #156 | Good $40,234 |
| Portuguese | 73.0 /100 | #157 | Good $40,177 |
| Immigrants | Senegal | 72.2 /100 | #158 | Good $40,157 |
| Immigrants | Vietnam | 72.0 /100 | #159 | Good $40,153 |
| Inupiat | 68.9 /100 | #160 | Good $40,080 |
| Alsatians | 68.0 /100 | #161 | Good $40,060 |
| South American Indians | 66.1 /100 | #162 | Good $40,019 |
| Lebanese | 65.5 /100 | #163 | Good $40,006 |
| Immigrants | Saudi Arabia | 62.9 /100 | #164 | Good $39,952 |
| Immigrants | Bangladesh | 60.8 /100 | #165 | Good $39,910 |
| Immigrants | Ghana | 60.0 /100 | #166 | Good $39,894 |
| Luxembourgers | 59.9 /100 | #167 | Average $39,891 |
| Immigrants | Peru | 58.9 /100 | #168 | Average $39,871 |
Demographics Similar to Sioux by Median Female Earnings
In terms of median female earnings, the demographic groups most similar to Sioux are Immigrants from Bahamas ($35,027, a difference of 0.10%), Honduran ($35,013, a difference of 0.14%), Fijian ($35,114, a difference of 0.15%), Chippewa ($35,003, a difference of 0.17%), and Bahamian ($35,125, a difference of 0.18%).
| Demographics | Rating | Rank | Median Female Earnings |
| Yuman | 0.0 /100 | #300 | Tragic $35,377 |
| Pima | 0.0 /100 | #301 | Tragic $35,326 |
| Blacks/African Americans | 0.0 /100 | #302 | Tragic $35,315 |
| Immigrants | Latin America | 0.0 /100 | #303 | Tragic $35,307 |
| Crow | 0.0 /100 | #304 | Tragic $35,266 |
| Bahamians | 0.0 /100 | #305 | Tragic $35,125 |
| Fijians | 0.0 /100 | #306 | Tragic $35,114 |
| Sioux | 0.0 /100 | #307 | Tragic $35,063 |
| Immigrants | Bahamas | 0.0 /100 | #308 | Tragic $35,027 |
| Hondurans | 0.0 /100 | #309 | Tragic $35,013 |
| Chippewa | 0.0 /100 | #310 | Tragic $35,003 |
| Ute | 0.0 /100 | #311 | Tragic $34,960 |
| Yaqui | 0.0 /100 | #312 | Tragic $34,943 |
| Cubans | 0.0 /100 | #313 | Tragic $34,942 |
| Apache | 0.0 /100 | #314 | Tragic $34,895 |