Alsatian vs Immigrants from Eritrea Master's Degree
COMPARE
Alsatian
Immigrants from Eritrea
Master's Degree
Master's Degree Comparison
Alsatians
Immigrants from Eritrea
16.9%
MASTER'S DEGREE
98.4/ 100
METRIC RATING
103rd/ 347
METRIC RANK
16.4%
MASTER'S DEGREE
95.5/ 100
METRIC RATING
124th/ 347
METRIC RANK
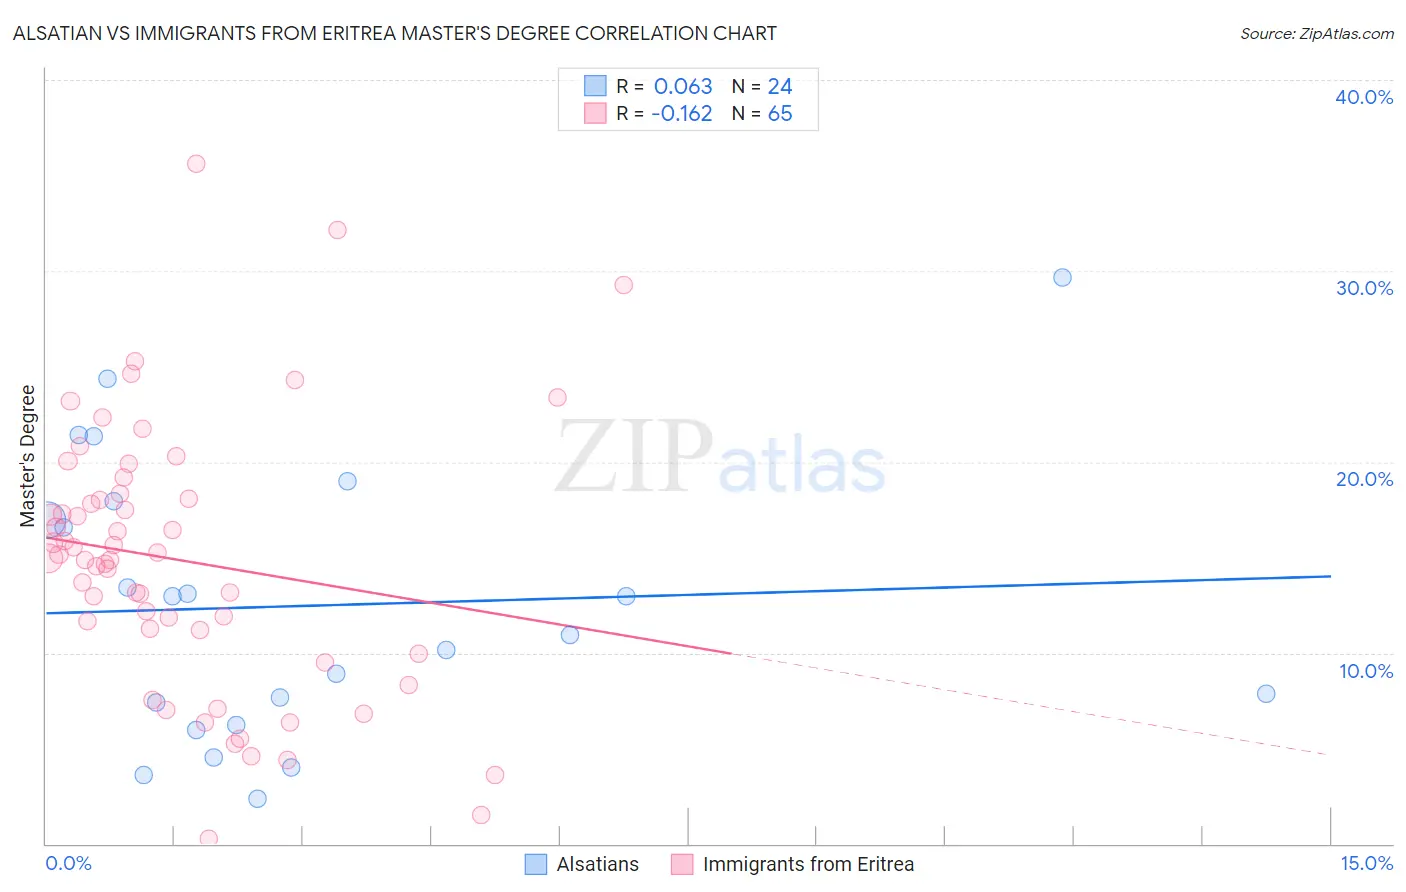
Alsatian vs Immigrants from Eritrea Master's Degree Correlation Chart
The statistical analysis conducted on geographies consisting of 82,679,386 people shows a slight positive correlation between the proportion of Alsatians and percentage of population with at least master's degree education in the United States with a correlation coefficient (R) of 0.063 and weighted average of 16.9%. Similarly, the statistical analysis conducted on geographies consisting of 104,847,630 people shows a poor negative correlation between the proportion of Immigrants from Eritrea and percentage of population with at least master's degree education in the United States with a correlation coefficient (R) of -0.162 and weighted average of 16.4%, a difference of 3.1%.
Master's Degree Correlation Summary
| Measurement | Alsatian | Immigrants from Eritrea |
| Minimum | 2.4% | 0.25% |
| Maximum | 29.7% | 35.6% |
| Range | 27.3% | 35.4% |
| Mean | 12.5% | 14.8% |
| Median | 11.9% | 15.0% |
| Interquartile 25% (IQ1) | 6.8% | 10.6% |
| Interquartile 75% (IQ3) | 17.4% | 18.2% |
| Interquartile Range (IQR) | 10.6% | 7.6% |
| Standard Deviation (Sample) | 7.2% | 7.0% |
| Standard Deviation (Population) | 7.1% | 7.0% |
Similar Demographics by Master's Degree
Demographics Similar to Alsatians by Master's Degree
In terms of master's degree, the demographic groups most similar to Alsatians are Ukrainian (16.9%, a difference of 0.12%), Syrian (16.8%, a difference of 0.22%), Chilean (16.9%, a difference of 0.33%), Immigrants from Nepal (17.0%, a difference of 0.41%), and Immigrants from Albania (16.8%, a difference of 0.50%).
| Demographics | Rating | Rank | Master's Degree |
| Immigrants | Northern Africa | 98.9 /100 | #96 | Exceptional 17.1% |
| Immigrants | England | 98.8 /100 | #97 | Exceptional 17.0% |
| Immigrants | Ukraine | 98.8 /100 | #98 | Exceptional 17.0% |
| Laotians | 98.8 /100 | #99 | Exceptional 17.0% |
| Albanians | 98.7 /100 | #100 | Exceptional 17.0% |
| Immigrants | Nepal | 98.6 /100 | #101 | Exceptional 17.0% |
| Chileans | 98.6 /100 | #102 | Exceptional 16.9% |
| Alsatians | 98.4 /100 | #103 | Exceptional 16.9% |
| Ukrainians | 98.3 /100 | #104 | Exceptional 16.9% |
| Syrians | 98.3 /100 | #105 | Exceptional 16.8% |
| Immigrants | Albania | 98.1 /100 | #106 | Exceptional 16.8% |
| Armenians | 98.0 /100 | #107 | Exceptional 16.8% |
| Sierra Leoneans | 98.0 /100 | #108 | Exceptional 16.8% |
| Moroccans | 98.0 /100 | #109 | Exceptional 16.8% |
| Immigrants | Chile | 98.0 /100 | #110 | Exceptional 16.8% |
Demographics Similar to Immigrants from Eritrea by Master's Degree
In terms of master's degree, the demographic groups most similar to Immigrants from Eritrea are Croatian (16.4%, a difference of 0.070%), Italian (16.4%, a difference of 0.070%), British (16.4%, a difference of 0.080%), Immigrants from Eastern Africa (16.3%, a difference of 0.19%), and Palestinian (16.3%, a difference of 0.45%).
| Demographics | Rating | Rank | Master's Degree |
| Immigrants | Moldova | 97.2 /100 | #117 | Exceptional 16.6% |
| Brazilians | 96.8 /100 | #118 | Exceptional 16.5% |
| Jordanians | 96.5 /100 | #119 | Exceptional 16.5% |
| Lebanese | 96.4 /100 | #120 | Exceptional 16.5% |
| Afghans | 96.2 /100 | #121 | Exceptional 16.5% |
| British | 95.6 /100 | #122 | Exceptional 16.4% |
| Croatians | 95.6 /100 | #123 | Exceptional 16.4% |
| Immigrants | Eritrea | 95.5 /100 | #124 | Exceptional 16.4% |
| Italians | 95.4 /100 | #125 | Exceptional 16.4% |
| Immigrants | Eastern Africa | 95.2 /100 | #126 | Exceptional 16.3% |
| Palestinians | 94.8 /100 | #127 | Exceptional 16.3% |
| Immigrants | Sierra Leone | 94.7 /100 | #128 | Exceptional 16.3% |
| Immigrants | Syria | 93.3 /100 | #129 | Exceptional 16.2% |
| Immigrants | Jordan | 92.7 /100 | #130 | Exceptional 16.1% |
| Taiwanese | 91.9 /100 | #131 | Exceptional 16.1% |