Aleut vs Sioux Householder Income Under 25 years
COMPARE
Aleut
Sioux
Householder Income Under 25 years
Householder Income Under 25 years Comparison
Aleuts
Sioux
$50,377
HOUSEHOLDER INCOME UNDER 25 YEARS
1.2/ 100
METRIC RATING
255th/ 347
METRIC RANK
$46,417
HOUSEHOLDER INCOME UNDER 25 YEARS
0.0/ 100
METRIC RATING
322nd/ 347
METRIC RANK
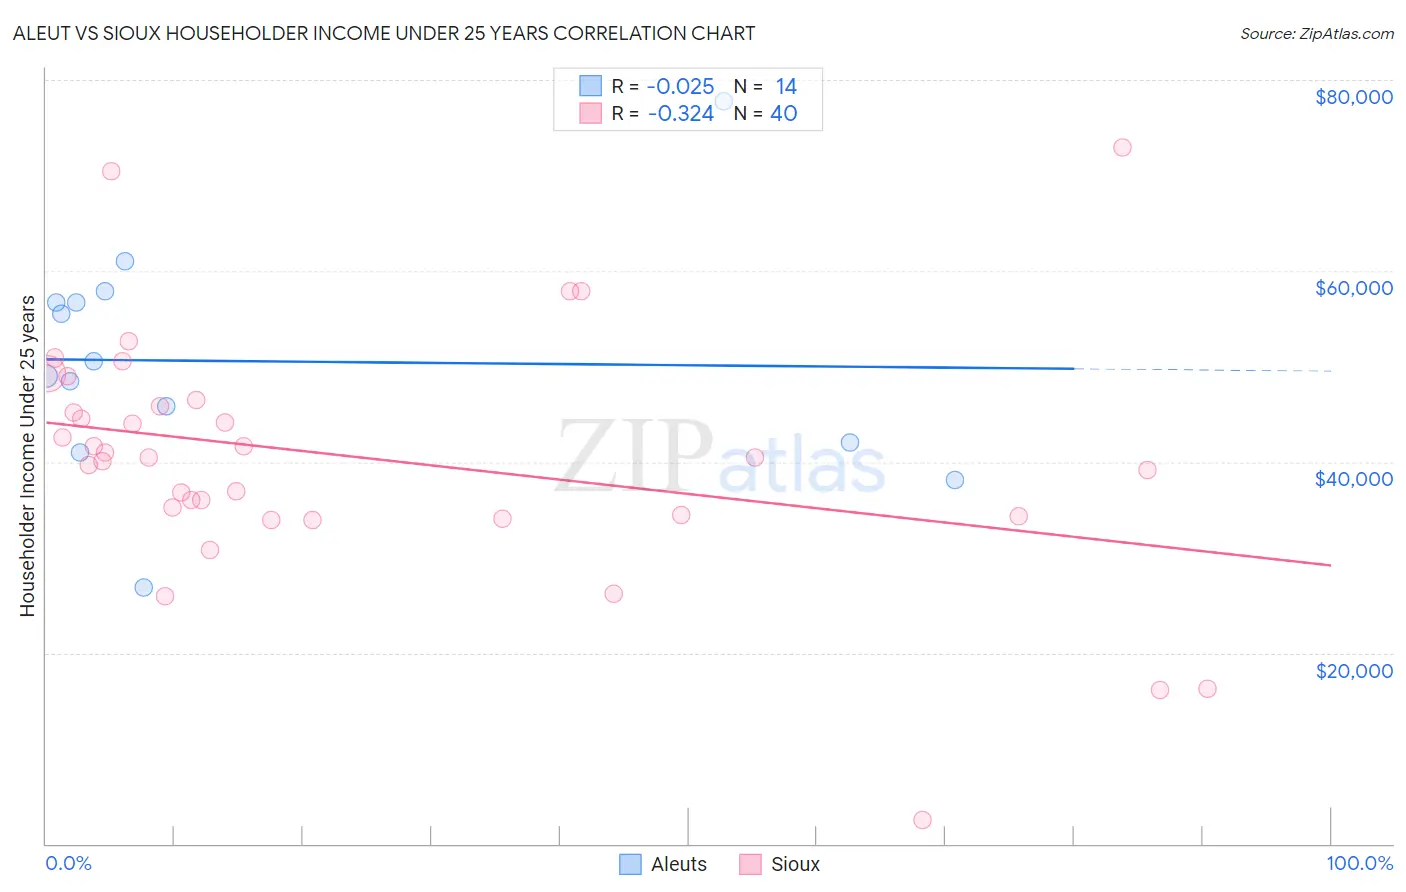
Aleut vs Sioux Householder Income Under 25 years Correlation Chart
The statistical analysis conducted on geographies consisting of 59,196,201 people shows no correlation between the proportion of Aleuts and household income with householder under the age of 25 in the United States with a correlation coefficient (R) of -0.025 and weighted average of $50,377. Similarly, the statistical analysis conducted on geographies consisting of 212,065,769 people shows a mild negative correlation between the proportion of Sioux and household income with householder under the age of 25 in the United States with a correlation coefficient (R) of -0.324 and weighted average of $46,417, a difference of 8.5%.
Householder Income Under 25 years Correlation Summary
| Measurement | Aleut | Sioux |
| Minimum | $26,849 | $2,499 |
| Maximum | $77,813 | $72,963 |
| Range | $50,964 | $70,464 |
| Mean | $50,533 | $40,443 |
| Median | $49,760 | $40,443 |
| Interquartile 25% (IQ1) | $42,031 | $34,375 |
| Interquartile 75% (IQ3) | $56,735 | $46,105 |
| Interquartile Range (IQR) | $14,704 | $11,730 |
| Standard Deviation (Sample) | $12,149 | $13,035 |
| Standard Deviation (Population) | $11,707 | $12,871 |
Similar Demographics by Householder Income Under 25 years
Demographics Similar to Aleuts by Householder Income Under 25 years
In terms of householder income under 25 years, the demographic groups most similar to Aleuts are Immigrants from Cuba ($50,374, a difference of 0.0%), Luxembourger ($50,379, a difference of 0.010%), Immigrants from Haiti ($50,398, a difference of 0.040%), Lebanese ($50,355, a difference of 0.040%), and White/Caucasian ($50,336, a difference of 0.080%).
| Demographics | Rating | Rank | Householder Income Under 25 years |
| Slavs | 1.8 /100 | #248 | Tragic $50,563 |
| Scottish | 1.8 /100 | #249 | Tragic $50,554 |
| Immigrants | Cabo Verde | 1.7 /100 | #250 | Tragic $50,520 |
| Celtics | 1.4 /100 | #251 | Tragic $50,447 |
| Immigrants | Mexico | 1.3 /100 | #252 | Tragic $50,422 |
| Immigrants | Haiti | 1.2 /100 | #253 | Tragic $50,398 |
| Luxembourgers | 1.2 /100 | #254 | Tragic $50,379 |
| Aleuts | 1.2 /100 | #255 | Tragic $50,377 |
| Immigrants | Cuba | 1.2 /100 | #256 | Tragic $50,374 |
| Lebanese | 1.1 /100 | #257 | Tragic $50,355 |
| Whites/Caucasians | 1.1 /100 | #258 | Tragic $50,336 |
| Immigrants | Dominica | 1.0 /100 | #259 | Tragic $50,301 |
| Hispanics or Latinos | 0.9 /100 | #260 | Tragic $50,279 |
| Hungarians | 0.9 /100 | #261 | Tragic $50,247 |
| Haitians | 0.8 /100 | #262 | Tragic $50,231 |
Demographics Similar to Sioux by Householder Income Under 25 years
In terms of householder income under 25 years, the demographic groups most similar to Sioux are Potawatomi ($46,462, a difference of 0.10%), Immigrants from Saudi Arabia ($46,187, a difference of 0.50%), Immigrants from Sudan ($46,791, a difference of 0.81%), African ($46,838, a difference of 0.91%), and Spanish American ($46,913, a difference of 1.1%).
| Demographics | Rating | Rank | Householder Income Under 25 years |
| Crow | 0.0 /100 | #315 | Tragic $47,012 |
| Sudanese | 0.0 /100 | #316 | Tragic $46,982 |
| Hopi | 0.0 /100 | #317 | Tragic $46,978 |
| Spanish Americans | 0.0 /100 | #318 | Tragic $46,913 |
| Africans | 0.0 /100 | #319 | Tragic $46,838 |
| Immigrants | Sudan | 0.0 /100 | #320 | Tragic $46,791 |
| Potawatomi | 0.0 /100 | #321 | Tragic $46,462 |
| Sioux | 0.0 /100 | #322 | Tragic $46,417 |
| Immigrants | Saudi Arabia | 0.0 /100 | #323 | Tragic $46,187 |
| Dutch West Indians | 0.0 /100 | #324 | Tragic $45,816 |
| Immigrants | Bahamas | 0.0 /100 | #325 | Tragic $45,793 |
| Osage | 0.0 /100 | #326 | Tragic $45,764 |
| Bahamians | 0.0 /100 | #327 | Tragic $45,743 |
| German Russians | 0.0 /100 | #328 | Tragic $45,673 |
| Seminole | 0.0 /100 | #329 | Tragic $45,649 |