Aleut vs Immigrants from Switzerland Householder Income Under 25 years
COMPARE
Aleut
Immigrants from Switzerland
Householder Income Under 25 years
Householder Income Under 25 years Comparison
Aleuts
Immigrants from Switzerland
$50,377
HOUSEHOLDER INCOME UNDER 25 YEARS
1.2/ 100
METRIC RATING
255th/ 347
METRIC RANK
$53,528
HOUSEHOLDER INCOME UNDER 25 YEARS
96.3/ 100
METRIC RATING
118th/ 347
METRIC RANK
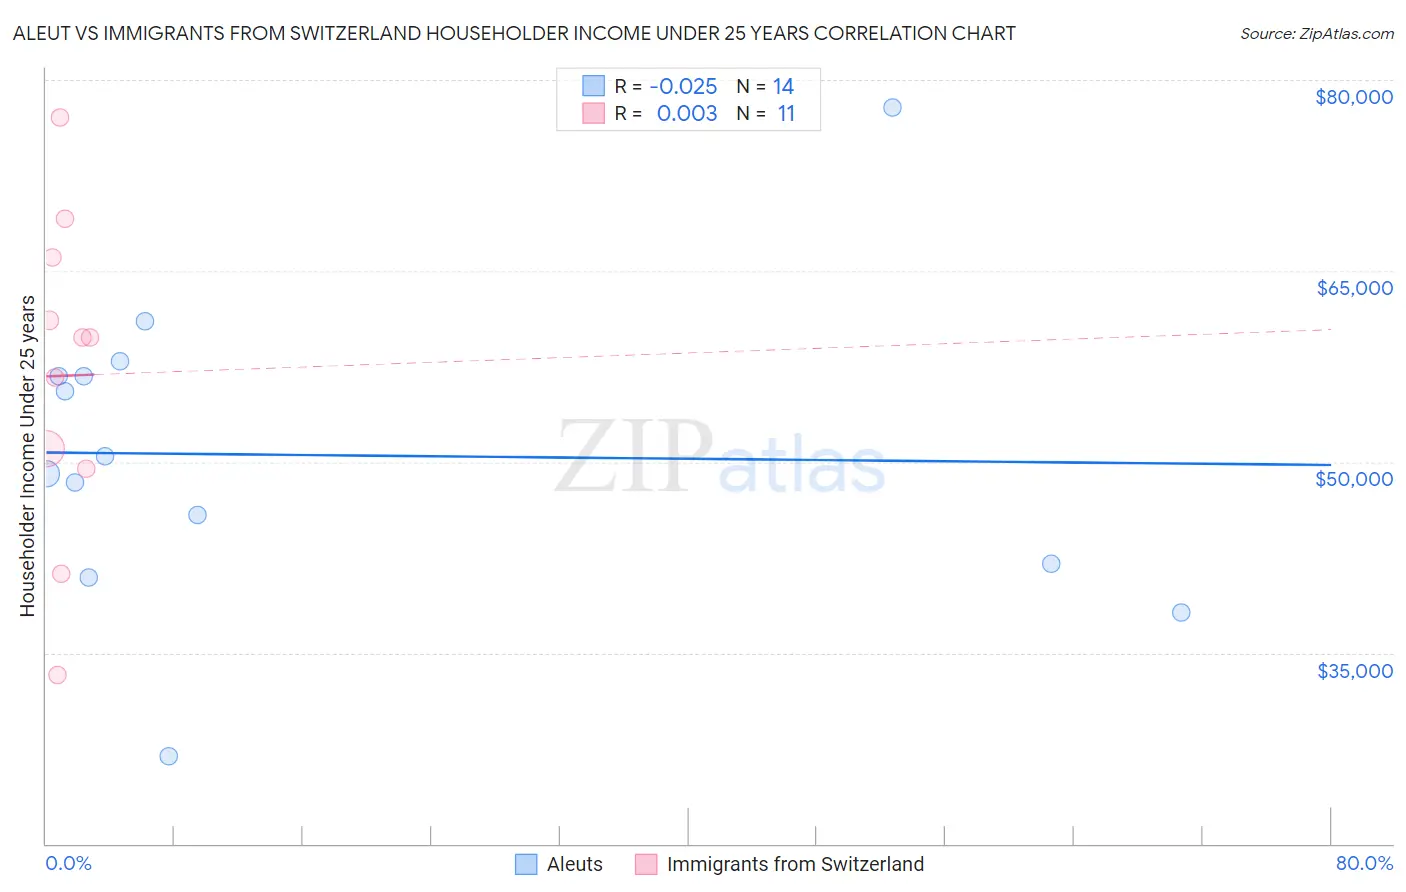
Aleut vs Immigrants from Switzerland Householder Income Under 25 years Correlation Chart
The statistical analysis conducted on geographies consisting of 59,196,201 people shows no correlation between the proportion of Aleuts and household income with householder under the age of 25 in the United States with a correlation coefficient (R) of -0.025 and weighted average of $50,377. Similarly, the statistical analysis conducted on geographies consisting of 131,601,890 people shows no correlation between the proportion of Immigrants from Switzerland and household income with householder under the age of 25 in the United States with a correlation coefficient (R) of 0.003 and weighted average of $53,528, a difference of 6.2%.
Householder Income Under 25 years Correlation Summary
| Measurement | Aleut | Immigrants from Switzerland |
| Minimum | $26,849 | $33,221 |
| Maximum | $77,813 | $77,010 |
| Range | $50,964 | $43,789 |
| Mean | $50,533 | $56,771 |
| Median | $49,760 | $59,792 |
| Interquartile 25% (IQ1) | $42,031 | $49,500 |
| Interquartile 75% (IQ3) | $56,735 | $66,059 |
| Interquartile Range (IQR) | $14,704 | $16,559 |
| Standard Deviation (Sample) | $12,149 | $12,523 |
| Standard Deviation (Population) | $11,707 | $11,940 |
Similar Demographics by Householder Income Under 25 years
Demographics Similar to Aleuts by Householder Income Under 25 years
In terms of householder income under 25 years, the demographic groups most similar to Aleuts are Immigrants from Cuba ($50,374, a difference of 0.0%), Luxembourger ($50,379, a difference of 0.010%), Immigrants from Haiti ($50,398, a difference of 0.040%), Lebanese ($50,355, a difference of 0.040%), and White/Caucasian ($50,336, a difference of 0.080%).
| Demographics | Rating | Rank | Householder Income Under 25 years |
| Slavs | 1.8 /100 | #248 | Tragic $50,563 |
| Scottish | 1.8 /100 | #249 | Tragic $50,554 |
| Immigrants | Cabo Verde | 1.7 /100 | #250 | Tragic $50,520 |
| Celtics | 1.4 /100 | #251 | Tragic $50,447 |
| Immigrants | Mexico | 1.3 /100 | #252 | Tragic $50,422 |
| Immigrants | Haiti | 1.2 /100 | #253 | Tragic $50,398 |
| Luxembourgers | 1.2 /100 | #254 | Tragic $50,379 |
| Aleuts | 1.2 /100 | #255 | Tragic $50,377 |
| Immigrants | Cuba | 1.2 /100 | #256 | Tragic $50,374 |
| Lebanese | 1.1 /100 | #257 | Tragic $50,355 |
| Whites/Caucasians | 1.1 /100 | #258 | Tragic $50,336 |
| Immigrants | Dominica | 1.0 /100 | #259 | Tragic $50,301 |
| Hispanics or Latinos | 0.9 /100 | #260 | Tragic $50,279 |
| Hungarians | 0.9 /100 | #261 | Tragic $50,247 |
| Haitians | 0.8 /100 | #262 | Tragic $50,231 |
Demographics Similar to Immigrants from Switzerland by Householder Income Under 25 years
In terms of householder income under 25 years, the demographic groups most similar to Immigrants from Switzerland are Lithuanian ($53,552, a difference of 0.050%), Immigrants from Spain ($53,560, a difference of 0.060%), Immigrants from Albania ($53,597, a difference of 0.13%), Immigrants from Sweden ($53,621, a difference of 0.17%), and Italian ($53,426, a difference of 0.19%).
| Demographics | Rating | Rank | Householder Income Under 25 years |
| Immigrants | Colombia | 97.7 /100 | #111 | Exceptional $53,714 |
| Immigrants | Oceania | 97.5 /100 | #112 | Exceptional $53,680 |
| Romanians | 97.2 /100 | #113 | Exceptional $53,632 |
| Immigrants | Sweden | 97.1 /100 | #114 | Exceptional $53,621 |
| Immigrants | Albania | 96.9 /100 | #115 | Exceptional $53,597 |
| Immigrants | Spain | 96.6 /100 | #116 | Exceptional $53,560 |
| Lithuanians | 96.6 /100 | #117 | Exceptional $53,552 |
| Immigrants | Switzerland | 96.3 /100 | #118 | Exceptional $53,528 |
| Italians | 95.4 /100 | #119 | Exceptional $53,426 |
| Guamanians/Chamorros | 95.3 /100 | #120 | Exceptional $53,423 |
| Immigrants | Canada | 95.2 /100 | #121 | Exceptional $53,411 |
| Immigrants | Ethiopia | 95.2 /100 | #122 | Exceptional $53,408 |
| Immigrants | Iraq | 94.9 /100 | #123 | Exceptional $53,384 |
| Colombians | 94.6 /100 | #124 | Exceptional $53,357 |
| Pakistanis | 94.1 /100 | #125 | Exceptional $53,325 |