Immigrants from Dominican Republic vs Sioux Householder Income Under 25 years
COMPARE
Immigrants from Dominican Republic
Sioux
Householder Income Under 25 years
Householder Income Under 25 years Comparison
Immigrants from Dominican Republic
Sioux
$50,204
HOUSEHOLDER INCOME UNDER 25 YEARS
0.8/ 100
METRIC RATING
263rd/ 347
METRIC RANK
$46,417
HOUSEHOLDER INCOME UNDER 25 YEARS
0.0/ 100
METRIC RATING
322nd/ 347
METRIC RANK
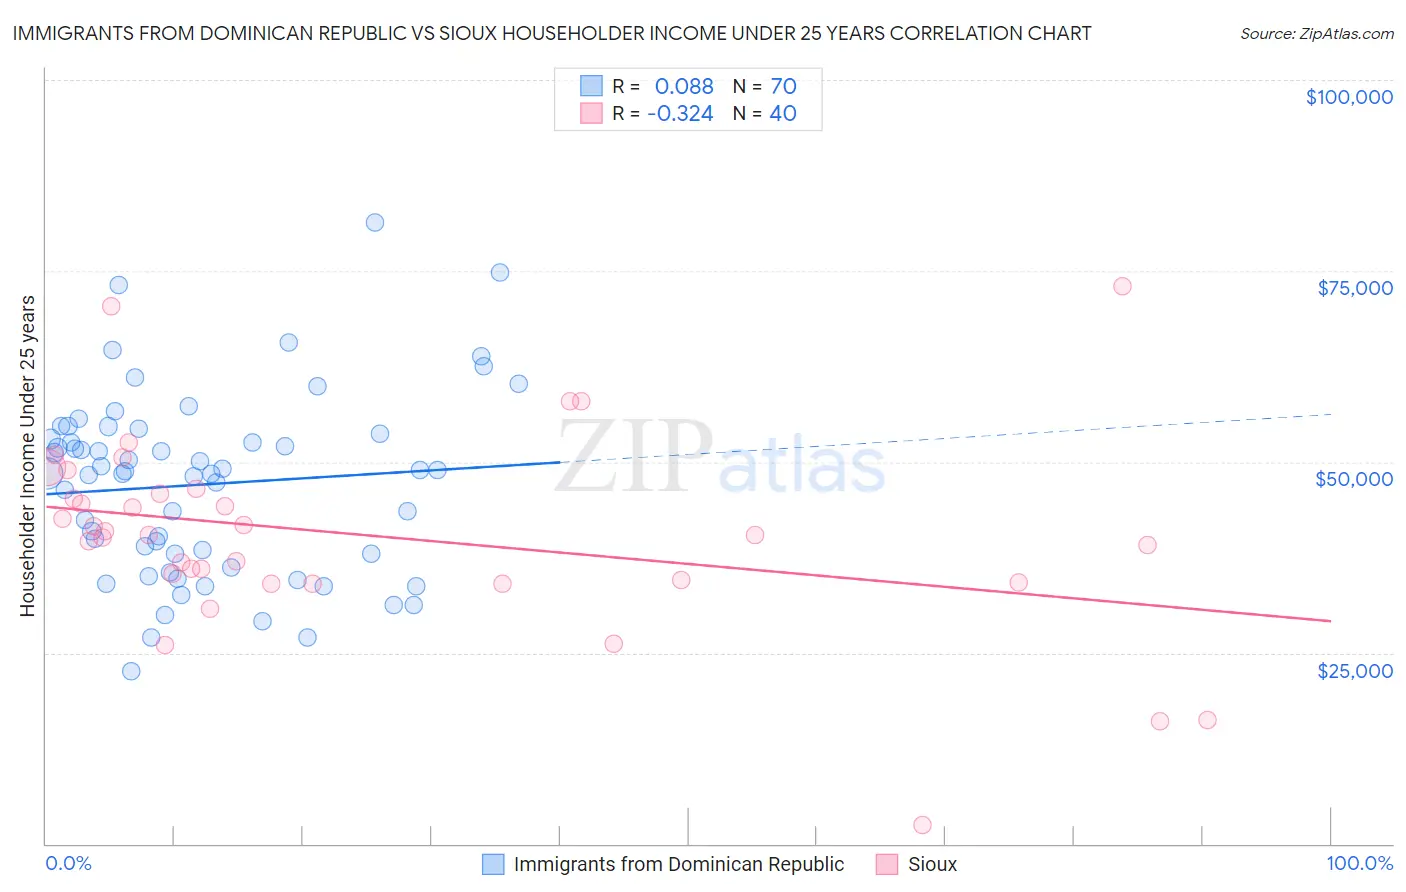
Immigrants from Dominican Republic vs Sioux Householder Income Under 25 years Correlation Chart
The statistical analysis conducted on geographies consisting of 234,366,360 people shows a slight positive correlation between the proportion of Immigrants from Dominican Republic and household income with householder under the age of 25 in the United States with a correlation coefficient (R) of 0.088 and weighted average of $50,204. Similarly, the statistical analysis conducted on geographies consisting of 212,065,769 people shows a mild negative correlation between the proportion of Sioux and household income with householder under the age of 25 in the United States with a correlation coefficient (R) of -0.324 and weighted average of $46,417, a difference of 8.2%.
Householder Income Under 25 years Correlation Summary
| Measurement | Immigrants from Dominican Republic | Sioux |
| Minimum | $22,546 | $2,499 |
| Maximum | $81,320 | $72,963 |
| Range | $58,774 | $70,464 |
| Mean | $47,058 | $40,443 |
| Median | $48,612 | $40,443 |
| Interquartile 25% (IQ1) | $37,938 | $34,375 |
| Interquartile 75% (IQ3) | $53,715 | $46,105 |
| Interquartile Range (IQR) | $15,777 | $11,730 |
| Standard Deviation (Sample) | $11,939 | $13,035 |
| Standard Deviation (Population) | $11,853 | $12,871 |
Similar Demographics by Householder Income Under 25 years
Demographics Similar to Immigrants from Dominican Republic by Householder Income Under 25 years
In terms of householder income under 25 years, the demographic groups most similar to Immigrants from Dominican Republic are Haitian ($50,231, a difference of 0.050%), Hungarian ($50,247, a difference of 0.090%), Fijian ($50,132, a difference of 0.14%), Hispanic or Latino ($50,279, a difference of 0.15%), and Belgian ($50,113, a difference of 0.18%).
| Demographics | Rating | Rank | Householder Income Under 25 years |
| Immigrants | Cuba | 1.2 /100 | #256 | Tragic $50,374 |
| Lebanese | 1.1 /100 | #257 | Tragic $50,355 |
| Whites/Caucasians | 1.1 /100 | #258 | Tragic $50,336 |
| Immigrants | Dominica | 1.0 /100 | #259 | Tragic $50,301 |
| Hispanics or Latinos | 0.9 /100 | #260 | Tragic $50,279 |
| Hungarians | 0.9 /100 | #261 | Tragic $50,247 |
| Haitians | 0.8 /100 | #262 | Tragic $50,231 |
| Immigrants | Dominican Republic | 0.8 /100 | #263 | Tragic $50,204 |
| Fijians | 0.6 /100 | #264 | Tragic $50,132 |
| Belgians | 0.6 /100 | #265 | Tragic $50,113 |
| Immigrants | Venezuela | 0.6 /100 | #266 | Tragic $50,109 |
| Immigrants | Laos | 0.5 /100 | #267 | Tragic $50,041 |
| Venezuelans | 0.5 /100 | #268 | Tragic $50,011 |
| Ute | 0.5 /100 | #269 | Tragic $49,997 |
| Mexicans | 0.5 /100 | #270 | Tragic $49,989 |
Demographics Similar to Sioux by Householder Income Under 25 years
In terms of householder income under 25 years, the demographic groups most similar to Sioux are Potawatomi ($46,462, a difference of 0.10%), Immigrants from Saudi Arabia ($46,187, a difference of 0.50%), Immigrants from Sudan ($46,791, a difference of 0.81%), African ($46,838, a difference of 0.91%), and Spanish American ($46,913, a difference of 1.1%).
| Demographics | Rating | Rank | Householder Income Under 25 years |
| Crow | 0.0 /100 | #315 | Tragic $47,012 |
| Sudanese | 0.0 /100 | #316 | Tragic $46,982 |
| Hopi | 0.0 /100 | #317 | Tragic $46,978 |
| Spanish Americans | 0.0 /100 | #318 | Tragic $46,913 |
| Africans | 0.0 /100 | #319 | Tragic $46,838 |
| Immigrants | Sudan | 0.0 /100 | #320 | Tragic $46,791 |
| Potawatomi | 0.0 /100 | #321 | Tragic $46,462 |
| Sioux | 0.0 /100 | #322 | Tragic $46,417 |
| Immigrants | Saudi Arabia | 0.0 /100 | #323 | Tragic $46,187 |
| Dutch West Indians | 0.0 /100 | #324 | Tragic $45,816 |
| Immigrants | Bahamas | 0.0 /100 | #325 | Tragic $45,793 |
| Osage | 0.0 /100 | #326 | Tragic $45,764 |
| Bahamians | 0.0 /100 | #327 | Tragic $45,743 |
| German Russians | 0.0 /100 | #328 | Tragic $45,673 |
| Seminole | 0.0 /100 | #329 | Tragic $45,649 |