Cypriot vs Sioux Householder Income Under 25 years
COMPARE
Cypriot
Sioux
Householder Income Under 25 years
Householder Income Under 25 years Comparison
Cypriots
Sioux
$52,209
HOUSEHOLDER INCOME UNDER 25 YEARS
51.2/ 100
METRIC RATING
172nd/ 347
METRIC RANK
$46,417
HOUSEHOLDER INCOME UNDER 25 YEARS
0.0/ 100
METRIC RATING
322nd/ 347
METRIC RANK
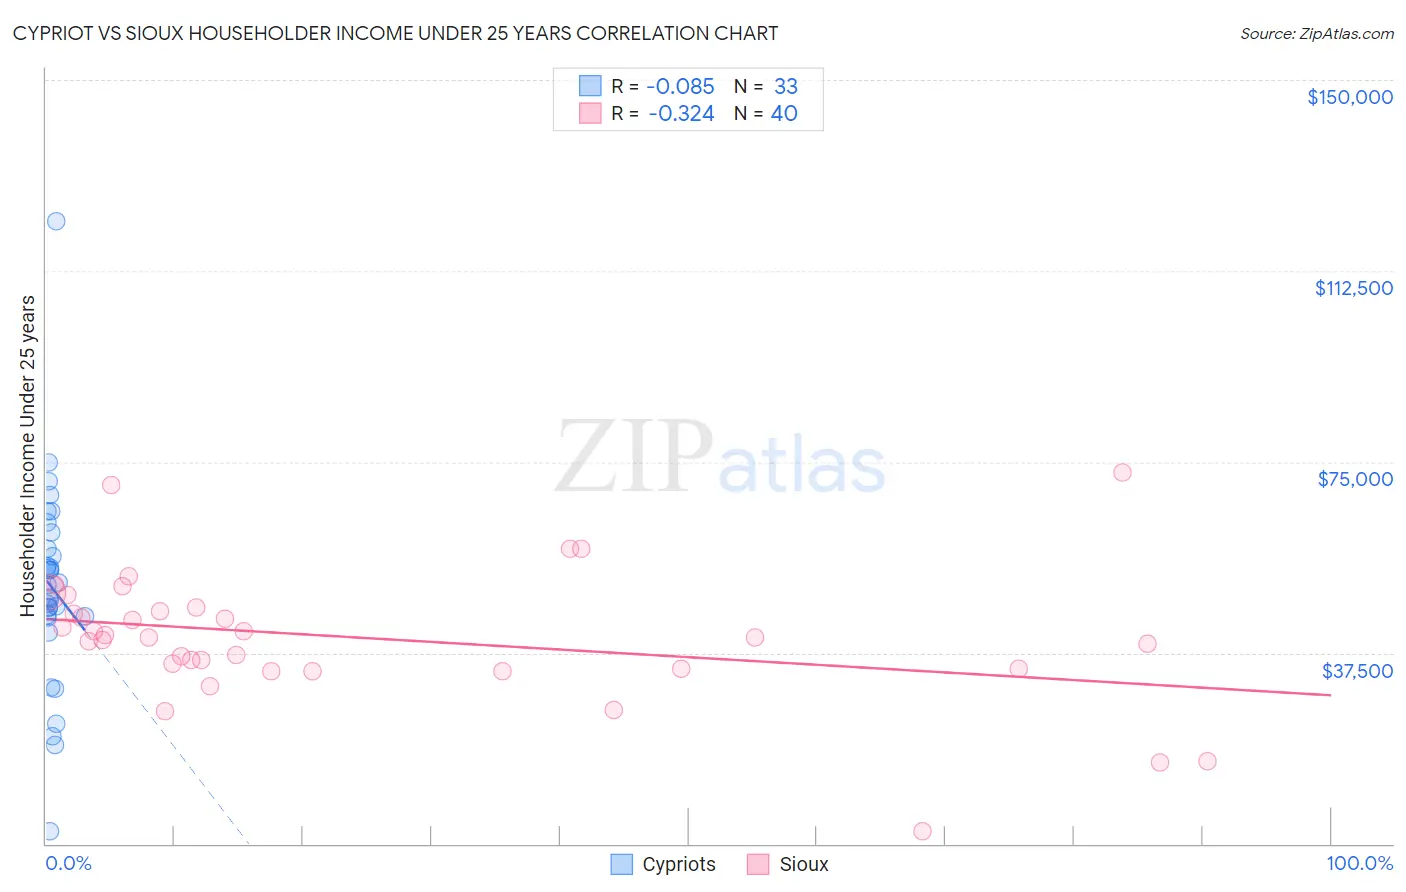
Cypriot vs Sioux Householder Income Under 25 years Correlation Chart
The statistical analysis conducted on geographies consisting of 57,005,304 people shows a slight negative correlation between the proportion of Cypriots and household income with householder under the age of 25 in the United States with a correlation coefficient (R) of -0.085 and weighted average of $52,209. Similarly, the statistical analysis conducted on geographies consisting of 212,065,769 people shows a mild negative correlation between the proportion of Sioux and household income with householder under the age of 25 in the United States with a correlation coefficient (R) of -0.324 and weighted average of $46,417, a difference of 12.5%.
Householder Income Under 25 years Correlation Summary
| Measurement | Cypriot | Sioux |
| Minimum | $2,499 | $2,499 |
| Maximum | $122,212 | $72,963 |
| Range | $119,713 | $70,464 |
| Mean | $50,436 | $40,443 |
| Median | $50,796 | $40,443 |
| Interquartile 25% (IQ1) | $44,534 | $34,375 |
| Interquartile 75% (IQ3) | $59,526 | $46,105 |
| Interquartile Range (IQR) | $14,992 | $11,730 |
| Standard Deviation (Sample) | $20,344 | $13,035 |
| Standard Deviation (Population) | $20,033 | $12,871 |
Similar Demographics by Householder Income Under 25 years
Demographics Similar to Cypriots by Householder Income Under 25 years
In terms of householder income under 25 years, the demographic groups most similar to Cypriots are Barbadian ($52,202, a difference of 0.010%), Immigrants from Western Asia ($52,190, a difference of 0.040%), Immigrants from Uruguay ($52,302, a difference of 0.18%), Canadian ($52,336, a difference of 0.24%), and Israeli ($52,335, a difference of 0.24%).
| Demographics | Rating | Rank | Householder Income Under 25 years |
| Poles | 63.0 /100 | #165 | Good $52,407 |
| Immigrants | Austria | 62.6 /100 | #166 | Good $52,400 |
| Immigrants | Uganda | 61.1 /100 | #167 | Good $52,374 |
| Japanese | 60.5 /100 | #168 | Good $52,365 |
| Canadians | 58.8 /100 | #169 | Average $52,336 |
| Israelis | 58.8 /100 | #170 | Average $52,335 |
| Immigrants | Uruguay | 56.8 /100 | #171 | Average $52,302 |
| Cypriots | 51.2 /100 | #172 | Average $52,209 |
| Barbadians | 50.8 /100 | #173 | Average $52,202 |
| Immigrants | Western Asia | 50.0 /100 | #174 | Average $52,190 |
| Immigrants | Zimbabwe | 33.8 /100 | #175 | Fair $51,914 |
| Austrians | 32.9 /100 | #176 | Fair $51,898 |
| British West Indians | 30.0 /100 | #177 | Fair $51,844 |
| Finns | 29.2 /100 | #178 | Fair $51,827 |
| Basques | 28.7 /100 | #179 | Fair $51,818 |
Demographics Similar to Sioux by Householder Income Under 25 years
In terms of householder income under 25 years, the demographic groups most similar to Sioux are Potawatomi ($46,462, a difference of 0.10%), Immigrants from Saudi Arabia ($46,187, a difference of 0.50%), Immigrants from Sudan ($46,791, a difference of 0.81%), African ($46,838, a difference of 0.91%), and Spanish American ($46,913, a difference of 1.1%).
| Demographics | Rating | Rank | Householder Income Under 25 years |
| Crow | 0.0 /100 | #315 | Tragic $47,012 |
| Sudanese | 0.0 /100 | #316 | Tragic $46,982 |
| Hopi | 0.0 /100 | #317 | Tragic $46,978 |
| Spanish Americans | 0.0 /100 | #318 | Tragic $46,913 |
| Africans | 0.0 /100 | #319 | Tragic $46,838 |
| Immigrants | Sudan | 0.0 /100 | #320 | Tragic $46,791 |
| Potawatomi | 0.0 /100 | #321 | Tragic $46,462 |
| Sioux | 0.0 /100 | #322 | Tragic $46,417 |
| Immigrants | Saudi Arabia | 0.0 /100 | #323 | Tragic $46,187 |
| Dutch West Indians | 0.0 /100 | #324 | Tragic $45,816 |
| Immigrants | Bahamas | 0.0 /100 | #325 | Tragic $45,793 |
| Osage | 0.0 /100 | #326 | Tragic $45,764 |
| Bahamians | 0.0 /100 | #327 | Tragic $45,743 |
| German Russians | 0.0 /100 | #328 | Tragic $45,673 |
| Seminole | 0.0 /100 | #329 | Tragic $45,649 |