Immigrants from Middle Africa vs Sioux Householder Income Under 25 years
COMPARE
Immigrants from Middle Africa
Sioux
Householder Income Under 25 years
Householder Income Under 25 years Comparison
Immigrants from Middle Africa
Sioux
$47,916
HOUSEHOLDER INCOME UNDER 25 YEARS
0.0/ 100
METRIC RATING
303rd/ 347
METRIC RANK
$46,417
HOUSEHOLDER INCOME UNDER 25 YEARS
0.0/ 100
METRIC RATING
322nd/ 347
METRIC RANK
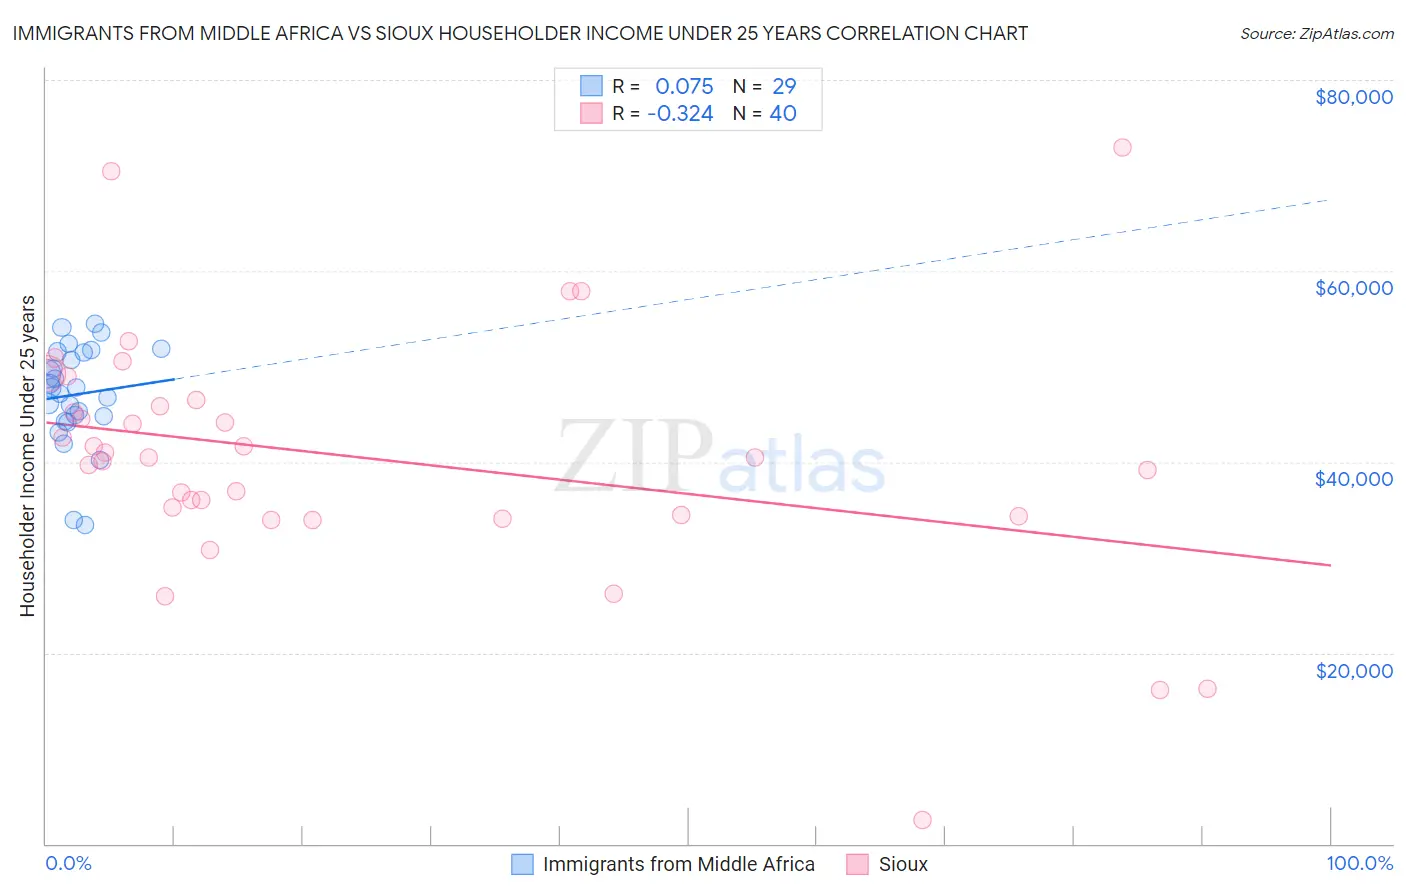
Immigrants from Middle Africa vs Sioux Householder Income Under 25 years Correlation Chart
The statistical analysis conducted on geographies consisting of 185,124,339 people shows a slight positive correlation between the proportion of Immigrants from Middle Africa and household income with householder under the age of 25 in the United States with a correlation coefficient (R) of 0.075 and weighted average of $47,916. Similarly, the statistical analysis conducted on geographies consisting of 212,065,769 people shows a mild negative correlation between the proportion of Sioux and household income with householder under the age of 25 in the United States with a correlation coefficient (R) of -0.324 and weighted average of $46,417, a difference of 3.2%.
Householder Income Under 25 years Correlation Summary
| Measurement | Immigrants from Middle Africa | Sioux |
| Minimum | $33,425 | $2,499 |
| Maximum | $54,425 | $72,963 |
| Range | $21,000 | $70,464 |
| Mean | $47,045 | $40,443 |
| Median | $47,736 | $40,443 |
| Interquartile 25% (IQ1) | $44,499 | $34,375 |
| Interquartile 75% (IQ3) | $51,465 | $46,105 |
| Interquartile Range (IQR) | $6,966 | $11,730 |
| Standard Deviation (Sample) | $5,237 | $13,035 |
| Standard Deviation (Population) | $5,146 | $12,871 |
Demographics Similar to Immigrants from Middle Africa and Sioux by Householder Income Under 25 years
In terms of householder income under 25 years, the demographic groups most similar to Immigrants from Middle Africa are Menominee ($47,907, a difference of 0.020%), Immigrants from Liberia ($47,981, a difference of 0.14%), Cherokee ($47,848, a difference of 0.14%), Native/Alaskan ($47,704, a difference of 0.44%), and Bangladeshi ($47,589, a difference of 0.69%). Similarly, the demographic groups most similar to Sioux are Potawatomi ($46,462, a difference of 0.10%), Immigrants from Sudan ($46,791, a difference of 0.81%), African ($46,838, a difference of 0.91%), Spanish American ($46,913, a difference of 1.1%), and Hopi ($46,978, a difference of 1.2%).
| Demographics | Rating | Rank | Householder Income Under 25 years |
| Immigrants | Liberia | 0.0 /100 | #302 | Tragic $47,981 |
| Immigrants | Middle Africa | 0.0 /100 | #303 | Tragic $47,916 |
| Menominee | 0.0 /100 | #304 | Tragic $47,907 |
| Cherokee | 0.0 /100 | #305 | Tragic $47,848 |
| Natives/Alaskans | 0.0 /100 | #306 | Tragic $47,704 |
| Bangladeshis | 0.0 /100 | #307 | Tragic $47,589 |
| Comanche | 0.0 /100 | #308 | Tragic $47,518 |
| U.S. Virgin Islanders | 0.0 /100 | #309 | Tragic $47,448 |
| Iroquois | 0.0 /100 | #310 | Tragic $47,380 |
| Ottawa | 0.0 /100 | #311 | Tragic $47,366 |
| Bermudans | 0.0 /100 | #312 | Tragic $47,359 |
| Delaware | 0.0 /100 | #313 | Tragic $47,159 |
| Chippewa | 0.0 /100 | #314 | Tragic $47,015 |
| Crow | 0.0 /100 | #315 | Tragic $47,012 |
| Sudanese | 0.0 /100 | #316 | Tragic $46,982 |
| Hopi | 0.0 /100 | #317 | Tragic $46,978 |
| Spanish Americans | 0.0 /100 | #318 | Tragic $46,913 |
| Africans | 0.0 /100 | #319 | Tragic $46,838 |
| Immigrants | Sudan | 0.0 /100 | #320 | Tragic $46,791 |
| Potawatomi | 0.0 /100 | #321 | Tragic $46,462 |
| Sioux | 0.0 /100 | #322 | Tragic $46,417 |