Aleut vs Navajo Householder Income Under 25 years
COMPARE
Aleut
Navajo
Householder Income Under 25 years
Householder Income Under 25 years Comparison
Aleuts
Navajo
$50,377
HOUSEHOLDER INCOME UNDER 25 YEARS
1.2/ 100
METRIC RATING
255th/ 347
METRIC RANK
$42,380
HOUSEHOLDER INCOME UNDER 25 YEARS
0.0/ 100
METRIC RATING
345th/ 347
METRIC RANK
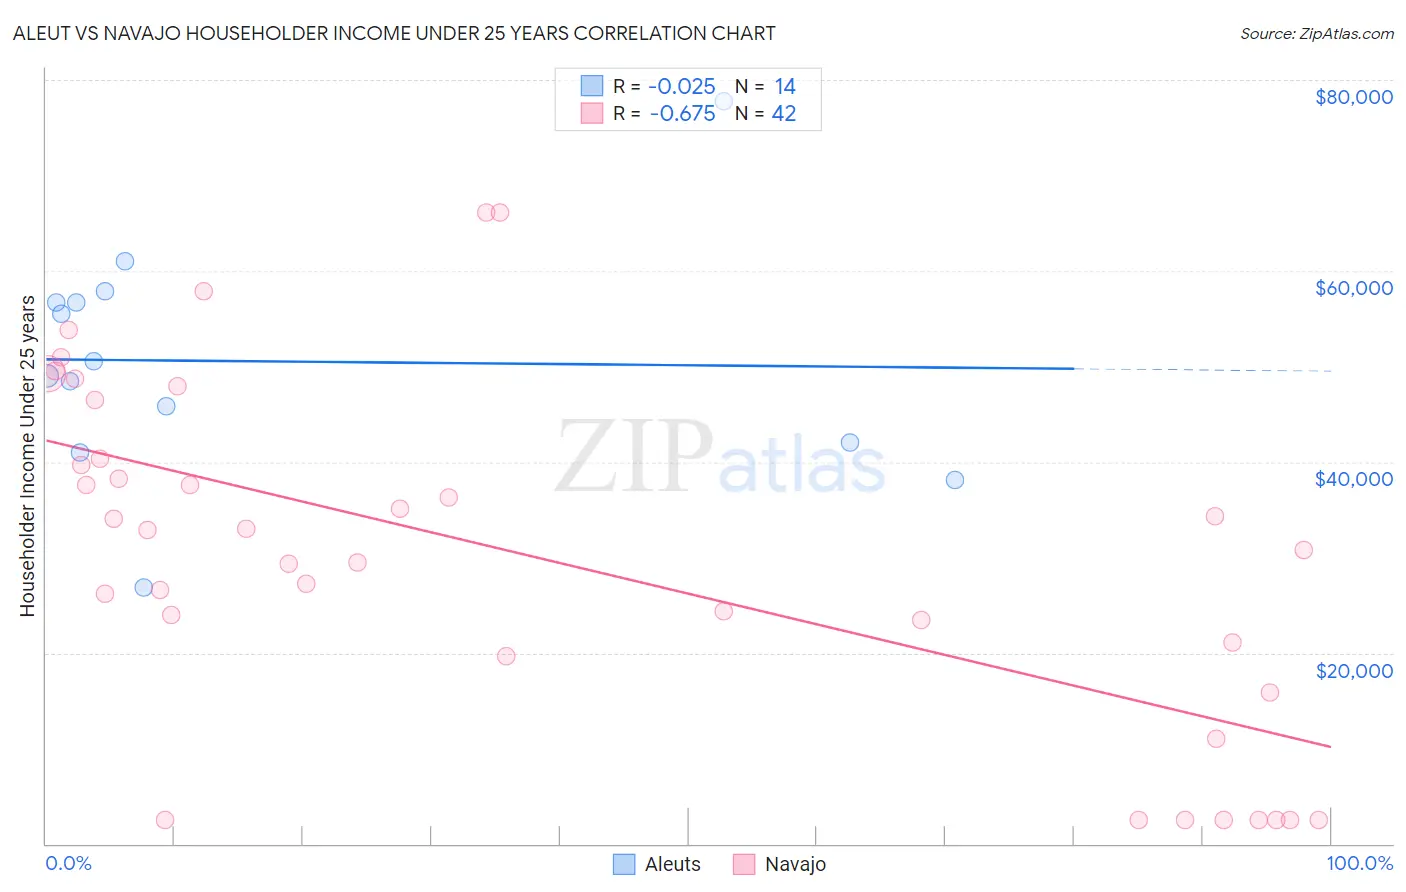
Aleut vs Navajo Householder Income Under 25 years Correlation Chart
The statistical analysis conducted on geographies consisting of 59,196,201 people shows no correlation between the proportion of Aleuts and household income with householder under the age of 25 in the United States with a correlation coefficient (R) of -0.025 and weighted average of $50,377. Similarly, the statistical analysis conducted on geographies consisting of 204,469,211 people shows a significant negative correlation between the proportion of Navajo and household income with householder under the age of 25 in the United States with a correlation coefficient (R) of -0.675 and weighted average of $42,380, a difference of 18.9%.
Householder Income Under 25 years Correlation Summary
| Measurement | Aleut | Navajo |
| Minimum | $26,849 | $2,499 |
| Maximum | $77,813 | $66,100 |
| Range | $50,964 | $63,601 |
| Mean | $50,533 | $30,108 |
| Median | $49,760 | $31,821 |
| Interquartile 25% (IQ1) | $42,031 | $19,702 |
| Interquartile 75% (IQ3) | $56,735 | $40,321 |
| Interquartile Range (IQR) | $14,704 | $20,619 |
| Standard Deviation (Sample) | $12,149 | $18,160 |
| Standard Deviation (Population) | $11,707 | $17,943 |
Similar Demographics by Householder Income Under 25 years
Demographics Similar to Aleuts by Householder Income Under 25 years
In terms of householder income under 25 years, the demographic groups most similar to Aleuts are Immigrants from Cuba ($50,374, a difference of 0.0%), Luxembourger ($50,379, a difference of 0.010%), Immigrants from Haiti ($50,398, a difference of 0.040%), Lebanese ($50,355, a difference of 0.040%), and White/Caucasian ($50,336, a difference of 0.080%).
| Demographics | Rating | Rank | Householder Income Under 25 years |
| Slavs | 1.8 /100 | #248 | Tragic $50,563 |
| Scottish | 1.8 /100 | #249 | Tragic $50,554 |
| Immigrants | Cabo Verde | 1.7 /100 | #250 | Tragic $50,520 |
| Celtics | 1.4 /100 | #251 | Tragic $50,447 |
| Immigrants | Mexico | 1.3 /100 | #252 | Tragic $50,422 |
| Immigrants | Haiti | 1.2 /100 | #253 | Tragic $50,398 |
| Luxembourgers | 1.2 /100 | #254 | Tragic $50,379 |
| Aleuts | 1.2 /100 | #255 | Tragic $50,377 |
| Immigrants | Cuba | 1.2 /100 | #256 | Tragic $50,374 |
| Lebanese | 1.1 /100 | #257 | Tragic $50,355 |
| Whites/Caucasians | 1.1 /100 | #258 | Tragic $50,336 |
| Immigrants | Dominica | 1.0 /100 | #259 | Tragic $50,301 |
| Hispanics or Latinos | 0.9 /100 | #260 | Tragic $50,279 |
| Hungarians | 0.9 /100 | #261 | Tragic $50,247 |
| Haitians | 0.8 /100 | #262 | Tragic $50,231 |
Demographics Similar to Navajo by Householder Income Under 25 years
In terms of householder income under 25 years, the demographic groups most similar to Navajo are Immigrants from Congo ($43,266, a difference of 2.1%), Immigrants from Yemen ($43,591, a difference of 2.9%), Arapaho ($44,003, a difference of 3.8%), Houma ($44,356, a difference of 4.7%), and Black/African American ($44,381, a difference of 4.7%).
| Demographics | Rating | Rank | Householder Income Under 25 years |
| Creek | 0.0 /100 | #333 | Tragic $45,371 |
| Cajuns | 0.0 /100 | #334 | Tragic $45,338 |
| Cheyenne | 0.0 /100 | #335 | Tragic $45,275 |
| Tohono O'odham | 0.0 /100 | #336 | Tragic $45,248 |
| Pueblo | 0.0 /100 | #337 | Tragic $45,018 |
| Chickasaw | 0.0 /100 | #338 | Tragic $44,763 |
| Kiowa | 0.0 /100 | #339 | Tragic $44,733 |
| Blacks/African Americans | 0.0 /100 | #340 | Tragic $44,381 |
| Houma | 0.0 /100 | #341 | Tragic $44,356 |
| Arapaho | 0.0 /100 | #342 | Tragic $44,003 |
| Immigrants | Yemen | 0.0 /100 | #343 | Tragic $43,591 |
| Immigrants | Congo | 0.0 /100 | #344 | Tragic $43,266 |
| Navajo | 0.0 /100 | #345 | Tragic $42,380 |
| Puerto Ricans | 0.0 /100 | #346 | Tragic $39,726 |
| Lumbee | 0.0 /100 | #347 | Tragic $34,584 |