Cherokee vs Sioux Householder Income Under 25 years
COMPARE
Cherokee
Sioux
Householder Income Under 25 years
Householder Income Under 25 years Comparison
Cherokee
Sioux
$47,848
HOUSEHOLDER INCOME UNDER 25 YEARS
0.0/ 100
METRIC RATING
305th/ 347
METRIC RANK
$46,417
HOUSEHOLDER INCOME UNDER 25 YEARS
0.0/ 100
METRIC RATING
322nd/ 347
METRIC RANK
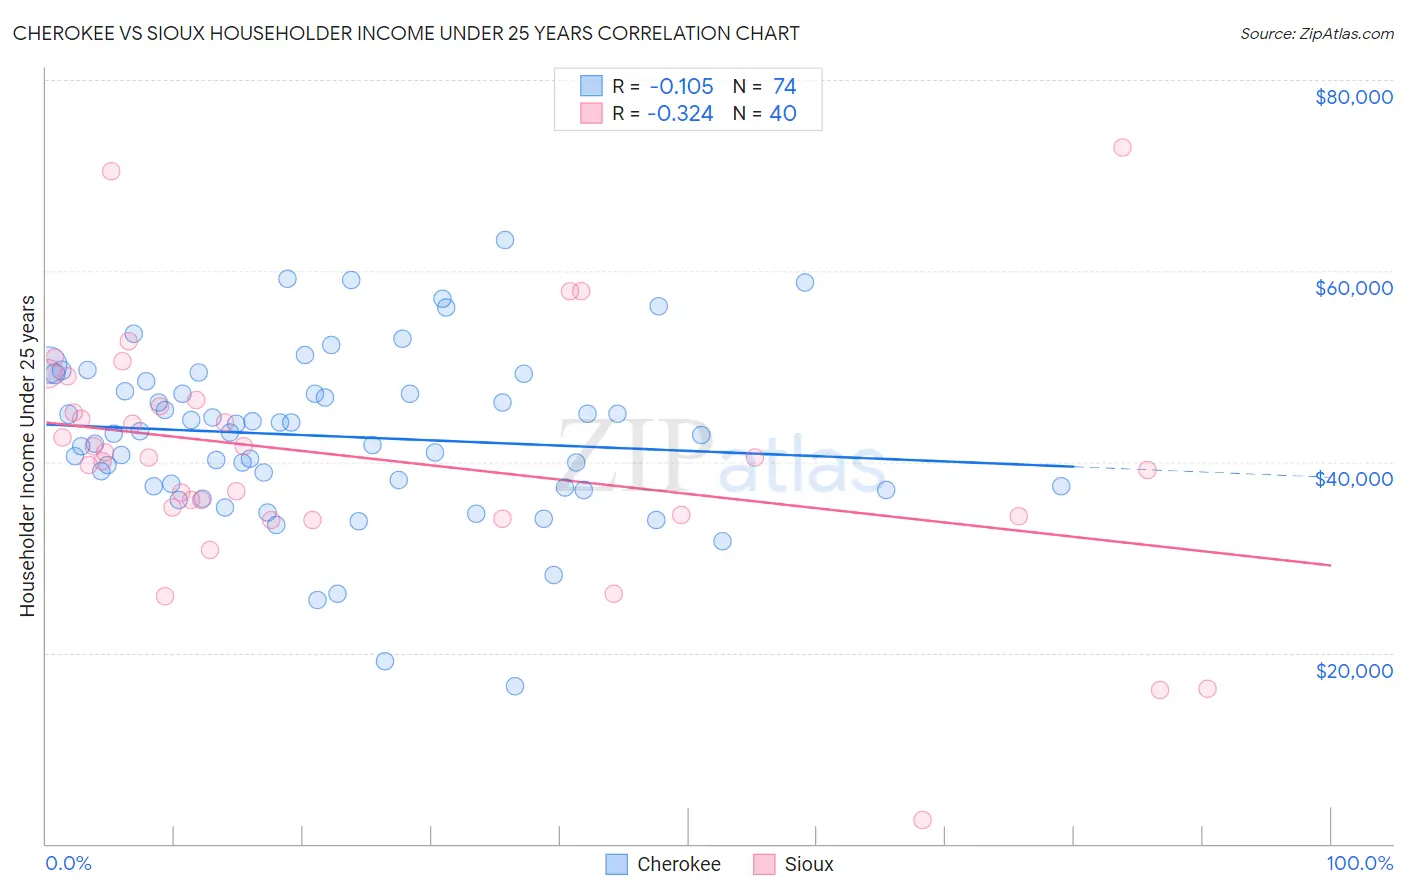
Cherokee vs Sioux Householder Income Under 25 years Correlation Chart
The statistical analysis conducted on geographies consisting of 404,177,711 people shows a poor negative correlation between the proportion of Cherokee and household income with householder under the age of 25 in the United States with a correlation coefficient (R) of -0.105 and weighted average of $47,848. Similarly, the statistical analysis conducted on geographies consisting of 212,065,769 people shows a mild negative correlation between the proportion of Sioux and household income with householder under the age of 25 in the United States with a correlation coefficient (R) of -0.324 and weighted average of $46,417, a difference of 3.1%.
Householder Income Under 25 years Correlation Summary
| Measurement | Cherokee | Sioux |
| Minimum | $16,563 | $2,499 |
| Maximum | $63,295 | $72,963 |
| Range | $46,732 | $70,464 |
| Mean | $42,680 | $40,443 |
| Median | $43,010 | $40,443 |
| Interquartile 25% (IQ1) | $37,476 | $34,375 |
| Interquartile 75% (IQ3) | $47,453 | $46,105 |
| Interquartile Range (IQR) | $9,977 | $11,730 |
| Standard Deviation (Sample) | $8,797 | $13,035 |
| Standard Deviation (Population) | $8,737 | $12,871 |
Demographics Similar to Cherokee and Sioux by Householder Income Under 25 years
In terms of householder income under 25 years, the demographic groups most similar to Cherokee are Menominee ($47,907, a difference of 0.12%), Immigrants from Middle Africa ($47,916, a difference of 0.14%), Native/Alaskan ($47,704, a difference of 0.30%), Bangladeshi ($47,589, a difference of 0.55%), and Comanche ($47,518, a difference of 0.69%). Similarly, the demographic groups most similar to Sioux are Potawatomi ($46,462, a difference of 0.10%), Immigrants from Saudi Arabia ($46,187, a difference of 0.50%), Immigrants from Sudan ($46,791, a difference of 0.81%), African ($46,838, a difference of 0.91%), and Spanish American ($46,913, a difference of 1.1%).
| Demographics | Rating | Rank | Householder Income Under 25 years |
| Immigrants | Middle Africa | 0.0 /100 | #303 | Tragic $47,916 |
| Menominee | 0.0 /100 | #304 | Tragic $47,907 |
| Cherokee | 0.0 /100 | #305 | Tragic $47,848 |
| Natives/Alaskans | 0.0 /100 | #306 | Tragic $47,704 |
| Bangladeshis | 0.0 /100 | #307 | Tragic $47,589 |
| Comanche | 0.0 /100 | #308 | Tragic $47,518 |
| U.S. Virgin Islanders | 0.0 /100 | #309 | Tragic $47,448 |
| Iroquois | 0.0 /100 | #310 | Tragic $47,380 |
| Ottawa | 0.0 /100 | #311 | Tragic $47,366 |
| Bermudans | 0.0 /100 | #312 | Tragic $47,359 |
| Delaware | 0.0 /100 | #313 | Tragic $47,159 |
| Chippewa | 0.0 /100 | #314 | Tragic $47,015 |
| Crow | 0.0 /100 | #315 | Tragic $47,012 |
| Sudanese | 0.0 /100 | #316 | Tragic $46,982 |
| Hopi | 0.0 /100 | #317 | Tragic $46,978 |
| Spanish Americans | 0.0 /100 | #318 | Tragic $46,913 |
| Africans | 0.0 /100 | #319 | Tragic $46,838 |
| Immigrants | Sudan | 0.0 /100 | #320 | Tragic $46,791 |
| Potawatomi | 0.0 /100 | #321 | Tragic $46,462 |
| Sioux | 0.0 /100 | #322 | Tragic $46,417 |
| Immigrants | Saudi Arabia | 0.0 /100 | #323 | Tragic $46,187 |