Aleut vs Sioux Unemployment Among Youth under 25 years
COMPARE
Aleut
Sioux
Unemployment Among Youth under 25 years
Unemployment Among Youth under 25 years Comparison
Aleuts
Sioux
14.1%
UNEMPLOYMENT AMONG YOUTH UNDER 25 YEARS
0.0/ 100
METRIC RATING
309th/ 347
METRIC RANK
14.4%
UNEMPLOYMENT AMONG YOUTH UNDER 25 YEARS
0.0/ 100
METRIC RATING
315th/ 347
METRIC RANK
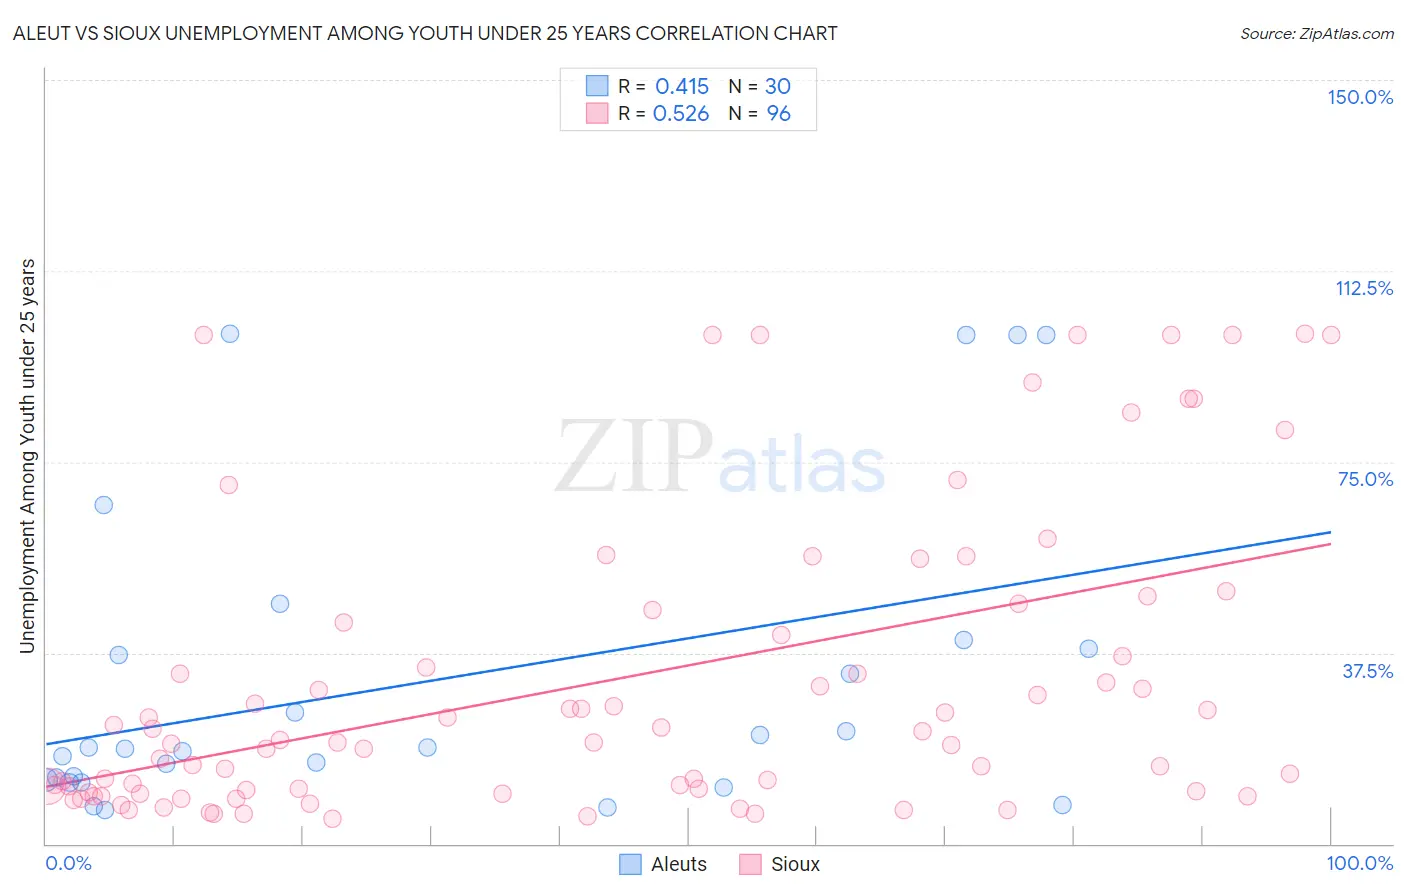
Aleut vs Sioux Unemployment Among Youth under 25 years Correlation Chart
The statistical analysis conducted on geographies consisting of 61,559,478 people shows a moderate positive correlation between the proportion of Aleuts and unemployment rate among youth under the age of 25 in the United States with a correlation coefficient (R) of 0.415 and weighted average of 14.1%. Similarly, the statistical analysis conducted on geographies consisting of 231,304,612 people shows a substantial positive correlation between the proportion of Sioux and unemployment rate among youth under the age of 25 in the United States with a correlation coefficient (R) of 0.526 and weighted average of 14.4%, a difference of 1.9%.
Unemployment Among Youth under 25 years Correlation Summary
| Measurement | Aleut | Sioux |
| Minimum | 6.6% | 4.9% |
| Maximum | 100.1% | 100.1% |
| Range | 93.5% | 95.2% |
| Mean | 31.9% | 32.1% |
| Median | 18.8% | 20.2% |
| Interquartile 25% (IQ1) | 12.4% | 10.5% |
| Interquartile 75% (IQ3) | 38.4% | 44.7% |
| Interquartile Range (IQR) | 26.0% | 34.2% |
| Standard Deviation (Sample) | 30.3% | 29.3% |
| Standard Deviation (Population) | 29.8% | 29.2% |
Demographics Similar to Aleuts and Sioux by Unemployment Among Youth under 25 years
In terms of unemployment among youth under 25 years, the demographic groups most similar to Aleuts are Immigrants from West Indies (14.2%, a difference of 0.54%), Immigrants from Bangladesh (14.2%, a difference of 0.57%), Immigrants from Belize (14.0%, a difference of 0.86%), Vietnamese (14.3%, a difference of 0.89%), and Immigrants from Haiti (14.0%, a difference of 1.3%). Similarly, the demographic groups most similar to Sioux are Jamaican (14.4%, a difference of 0.11%), Immigrants from Armenia (14.4%, a difference of 0.20%), Native/Alaskan (14.5%, a difference of 0.42%), Black/African American (14.5%, a difference of 0.51%), and Vietnamese (14.3%, a difference of 1.0%).
| Demographics | Rating | Rank | Unemployment Among Youth under 25 years |
| Immigrants | Sierra Leone | 0.0 /100 | #302 | Tragic 13.8% |
| Belizeans | 0.0 /100 | #303 | Tragic 13.8% |
| Houma | 0.0 /100 | #304 | Tragic 13.8% |
| Haitians | 0.0 /100 | #305 | Tragic 13.9% |
| Pueblo | 0.0 /100 | #306 | Tragic 13.9% |
| Immigrants | Haiti | 0.0 /100 | #307 | Tragic 14.0% |
| Immigrants | Belize | 0.0 /100 | #308 | Tragic 14.0% |
| Aleuts | 0.0 /100 | #309 | Tragic 14.1% |
| Immigrants | West Indies | 0.0 /100 | #310 | Tragic 14.2% |
| Immigrants | Bangladesh | 0.0 /100 | #311 | Tragic 14.2% |
| Vietnamese | 0.0 /100 | #312 | Tragic 14.3% |
| Immigrants | Armenia | 0.0 /100 | #313 | Tragic 14.4% |
| Jamaicans | 0.0 /100 | #314 | Tragic 14.4% |
| Sioux | 0.0 /100 | #315 | Tragic 14.4% |
| Natives/Alaskans | 0.0 /100 | #316 | Tragic 14.5% |
| Blacks/African Americans | 0.0 /100 | #317 | Tragic 14.5% |
| Immigrants | Dominica | 0.0 /100 | #318 | Tragic 14.6% |
| West Indians | 0.0 /100 | #319 | Tragic 14.6% |
| Barbadians | 0.0 /100 | #320 | Tragic 14.6% |
| Cheyenne | 0.0 /100 | #321 | Tragic 14.6% |
| Trinidadians and Tobagonians | 0.0 /100 | #322 | Tragic 14.6% |