Aleut vs Spanish Householder Income Under 25 years
COMPARE
Aleut
Spanish
Householder Income Under 25 years
Householder Income Under 25 years Comparison
Aleuts
Spanish
$50,377
HOUSEHOLDER INCOME UNDER 25 YEARS
1.2/ 100
METRIC RATING
255th/ 347
METRIC RANK
$50,813
HOUSEHOLDER INCOME UNDER 25 YEARS
3.3/ 100
METRIC RATING
235th/ 347
METRIC RANK
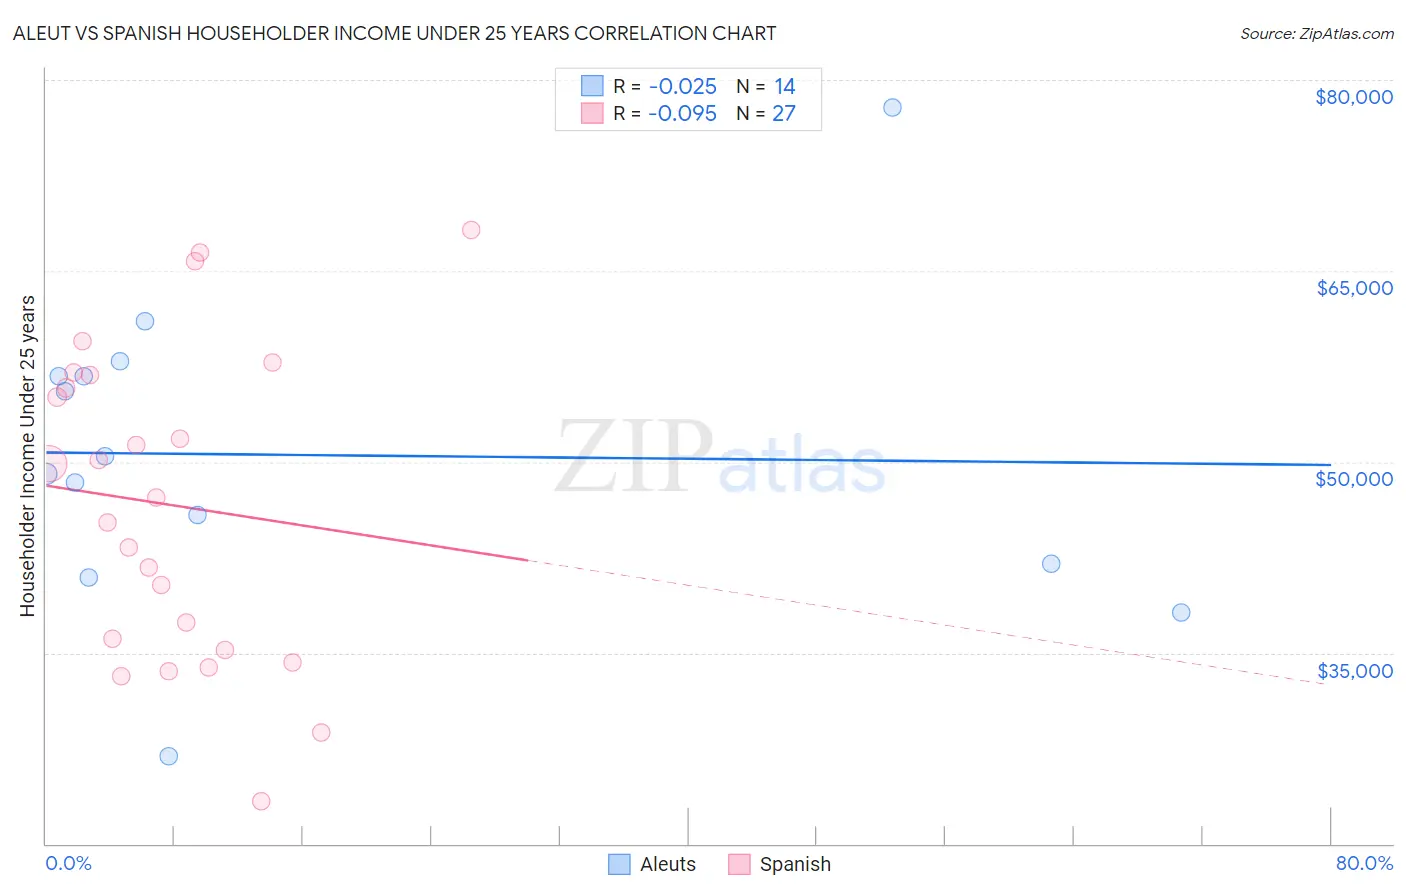
Aleut vs Spanish Householder Income Under 25 years Correlation Chart
The statistical analysis conducted on geographies consisting of 59,196,201 people shows no correlation between the proportion of Aleuts and household income with householder under the age of 25 in the United States with a correlation coefficient (R) of -0.025 and weighted average of $50,377. Similarly, the statistical analysis conducted on geographies consisting of 354,725,982 people shows a slight negative correlation between the proportion of Spanish and household income with householder under the age of 25 in the United States with a correlation coefficient (R) of -0.095 and weighted average of $50,813, a difference of 0.87%.
Householder Income Under 25 years Correlation Summary
| Measurement | Aleut | Spanish |
| Minimum | $26,849 | $23,340 |
| Maximum | $77,813 | $68,194 |
| Range | $50,964 | $44,854 |
| Mean | $50,533 | $46,630 |
| Median | $49,760 | $47,181 |
| Interquartile 25% (IQ1) | $42,031 | $35,245 |
| Interquartile 75% (IQ3) | $56,735 | $56,851 |
| Interquartile Range (IQR) | $14,704 | $21,606 |
| Standard Deviation (Sample) | $12,149 | $12,229 |
| Standard Deviation (Population) | $11,707 | $12,001 |
Demographics Similar to Aleuts and Spanish by Householder Income Under 25 years
In terms of householder income under 25 years, the demographic groups most similar to Aleuts are Luxembourger ($50,379, a difference of 0.010%), Immigrants from Haiti ($50,398, a difference of 0.040%), Immigrants from Mexico ($50,422, a difference of 0.090%), Celtic ($50,447, a difference of 0.14%), and Immigrants from Cabo Verde ($50,520, a difference of 0.28%). Similarly, the demographic groups most similar to Spanish are English ($50,805, a difference of 0.020%), German ($50,804, a difference of 0.020%), Iraqi ($50,802, a difference of 0.020%), Immigrants from Caribbean ($50,757, a difference of 0.11%), and Immigrants from Lebanon ($50,729, a difference of 0.16%).
| Demographics | Rating | Rank | Householder Income Under 25 years |
| Spanish | 3.3 /100 | #235 | Tragic $50,813 |
| English | 3.3 /100 | #236 | Tragic $50,805 |
| Germans | 3.3 /100 | #237 | Tragic $50,804 |
| Iraqis | 3.2 /100 | #238 | Tragic $50,802 |
| Immigrants | Caribbean | 2.9 /100 | #239 | Tragic $50,757 |
| Immigrants | Lebanon | 2.7 /100 | #240 | Tragic $50,729 |
| Immigrants | Micronesia | 2.5 /100 | #241 | Tragic $50,691 |
| Cubans | 2.3 /100 | #242 | Tragic $50,655 |
| Immigrants | Thailand | 2.2 /100 | #243 | Tragic $50,645 |
| Marshallese | 2.1 /100 | #244 | Tragic $50,627 |
| Immigrants | Africa | 2.0 /100 | #245 | Tragic $50,609 |
| Welsh | 2.0 /100 | #246 | Tragic $50,597 |
| Immigrants | Bosnia and Herzegovina | 1.8 /100 | #247 | Tragic $50,565 |
| Slavs | 1.8 /100 | #248 | Tragic $50,563 |
| Scottish | 1.8 /100 | #249 | Tragic $50,554 |
| Immigrants | Cabo Verde | 1.7 /100 | #250 | Tragic $50,520 |
| Celtics | 1.4 /100 | #251 | Tragic $50,447 |
| Immigrants | Mexico | 1.3 /100 | #252 | Tragic $50,422 |
| Immigrants | Haiti | 1.2 /100 | #253 | Tragic $50,398 |
| Luxembourgers | 1.2 /100 | #254 | Tragic $50,379 |
| Aleuts | 1.2 /100 | #255 | Tragic $50,377 |