Aleut vs Slovak Householder Income Under 25 years
COMPARE
Aleut
Slovak
Householder Income Under 25 years
Householder Income Under 25 years Comparison
Aleuts
Slovaks
$50,377
HOUSEHOLDER INCOME UNDER 25 YEARS
1.2/ 100
METRIC RATING
255th/ 347
METRIC RANK
$49,753
HOUSEHOLDER INCOME UNDER 25 YEARS
0.3/ 100
METRIC RATING
273rd/ 347
METRIC RANK
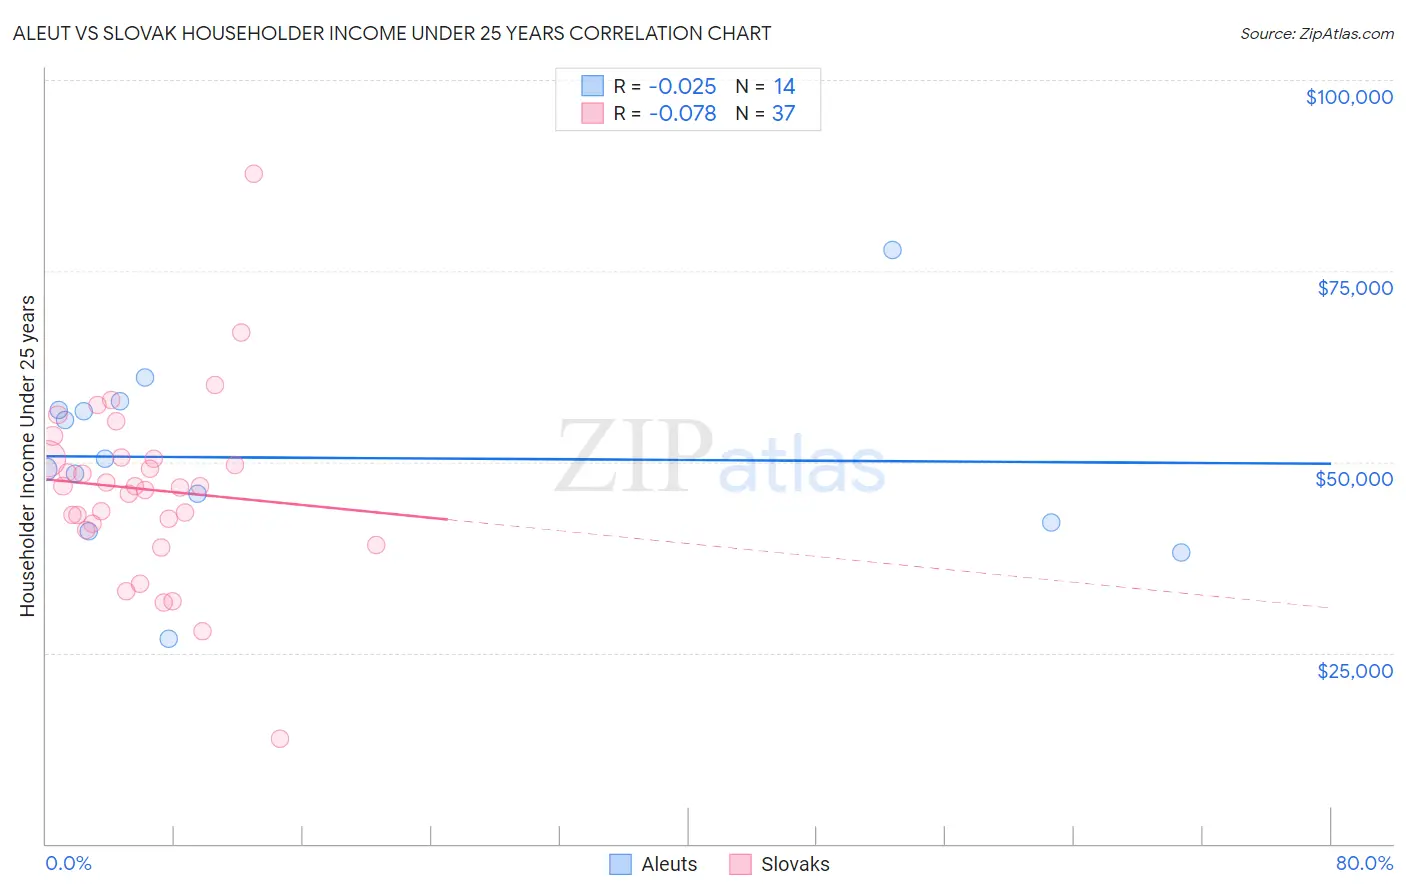
Aleut vs Slovak Householder Income Under 25 years Correlation Chart
The statistical analysis conducted on geographies consisting of 59,196,201 people shows no correlation between the proportion of Aleuts and household income with householder under the age of 25 in the United States with a correlation coefficient (R) of -0.025 and weighted average of $50,377. Similarly, the statistical analysis conducted on geographies consisting of 328,630,657 people shows a slight negative correlation between the proportion of Slovaks and household income with householder under the age of 25 in the United States with a correlation coefficient (R) of -0.078 and weighted average of $49,753, a difference of 1.3%.
Householder Income Under 25 years Correlation Summary
| Measurement | Aleut | Slovak |
| Minimum | $26,849 | $13,750 |
| Maximum | $77,813 | $87,793 |
| Range | $50,964 | $74,043 |
| Mean | $50,533 | $46,421 |
| Median | $49,760 | $46,765 |
| Interquartile 25% (IQ1) | $42,031 | $41,531 |
| Interquartile 75% (IQ3) | $56,735 | $50,443 |
| Interquartile Range (IQR) | $14,704 | $8,912 |
| Standard Deviation (Sample) | $12,149 | $12,103 |
| Standard Deviation (Population) | $11,707 | $11,938 |
Demographics Similar to Aleuts and Slovaks by Householder Income Under 25 years
In terms of householder income under 25 years, the demographic groups most similar to Aleuts are Immigrants from Cuba ($50,374, a difference of 0.0%), Luxembourger ($50,379, a difference of 0.010%), Lebanese ($50,355, a difference of 0.040%), White/Caucasian ($50,336, a difference of 0.080%), and Immigrants from Dominica ($50,301, a difference of 0.15%). Similarly, the demographic groups most similar to Slovaks are Immigrants from Senegal ($49,742, a difference of 0.020%), Colville ($49,774, a difference of 0.040%), Taiwanese ($49,804, a difference of 0.10%), Mexican ($49,989, a difference of 0.48%), and Ute ($49,997, a difference of 0.49%).
| Demographics | Rating | Rank | Householder Income Under 25 years |
| Luxembourgers | 1.2 /100 | #254 | Tragic $50,379 |
| Aleuts | 1.2 /100 | #255 | Tragic $50,377 |
| Immigrants | Cuba | 1.2 /100 | #256 | Tragic $50,374 |
| Lebanese | 1.1 /100 | #257 | Tragic $50,355 |
| Whites/Caucasians | 1.1 /100 | #258 | Tragic $50,336 |
| Immigrants | Dominica | 1.0 /100 | #259 | Tragic $50,301 |
| Hispanics or Latinos | 0.9 /100 | #260 | Tragic $50,279 |
| Hungarians | 0.9 /100 | #261 | Tragic $50,247 |
| Haitians | 0.8 /100 | #262 | Tragic $50,231 |
| Immigrants | Dominican Republic | 0.8 /100 | #263 | Tragic $50,204 |
| Fijians | 0.6 /100 | #264 | Tragic $50,132 |
| Belgians | 0.6 /100 | #265 | Tragic $50,113 |
| Immigrants | Venezuela | 0.6 /100 | #266 | Tragic $50,109 |
| Immigrants | Laos | 0.5 /100 | #267 | Tragic $50,041 |
| Venezuelans | 0.5 /100 | #268 | Tragic $50,011 |
| Ute | 0.5 /100 | #269 | Tragic $49,997 |
| Mexicans | 0.5 /100 | #270 | Tragic $49,989 |
| Taiwanese | 0.3 /100 | #271 | Tragic $49,804 |
| Colville | 0.3 /100 | #272 | Tragic $49,774 |
| Slovaks | 0.3 /100 | #273 | Tragic $49,753 |
| Immigrants | Senegal | 0.3 /100 | #274 | Tragic $49,742 |