Portuguese vs Turkish Median Female Earnings
COMPARE
Portuguese
Turkish
Median Female Earnings
Median Female Earnings Comparison
Portuguese
Turks
$40,177
MEDIAN FEMALE EARNINGS
73.0/ 100
METRIC RATING
157th/ 347
METRIC RANK
$44,695
MEDIAN FEMALE EARNINGS
100.0/ 100
METRIC RATING
27th/ 347
METRIC RANK
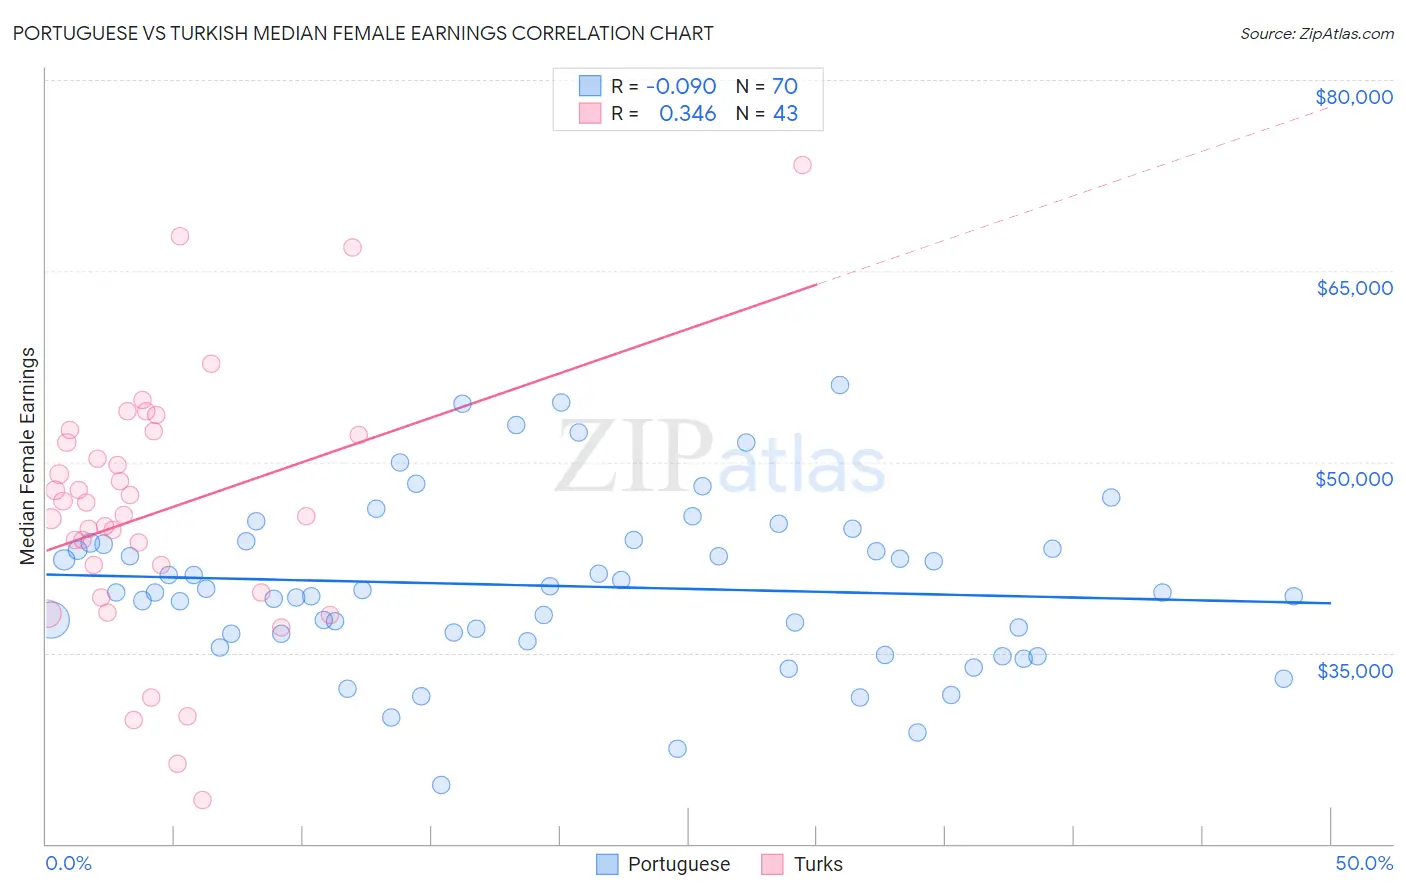
Portuguese vs Turkish Median Female Earnings Correlation Chart
The statistical analysis conducted on geographies consisting of 449,940,574 people shows a slight negative correlation between the proportion of Portuguese and median female earnings in the United States with a correlation coefficient (R) of -0.090 and weighted average of $40,177. Similarly, the statistical analysis conducted on geographies consisting of 271,816,857 people shows a mild positive correlation between the proportion of Turks and median female earnings in the United States with a correlation coefficient (R) of 0.346 and weighted average of $44,695, a difference of 11.3%.
Median Female Earnings Correlation Summary
| Measurement | Portuguese | Turkish |
| Minimum | $24,606 | $23,409 |
| Maximum | $56,053 | $73,333 |
| Range | $31,447 | $49,924 |
| Mean | $40,249 | $46,115 |
| Median | $39,749 | $45,875 |
| Interquartile 25% (IQ1) | $36,452 | $39,746 |
| Interquartile 75% (IQ3) | $43,632 | $52,083 |
| Interquartile Range (IQR) | $7,179 | $12,337 |
| Standard Deviation (Sample) | $6,533 | $10,119 |
| Standard Deviation (Population) | $6,486 | $10,000 |
Similar Demographics by Median Female Earnings
Demographics Similar to Portuguese by Median Female Earnings
In terms of median female earnings, the demographic groups most similar to Portuguese are Immigrants from Senegal ($40,157, a difference of 0.050%), Immigrants from Vietnam ($40,153, a difference of 0.060%), Peruvian ($40,234, a difference of 0.14%), Immigrants from Africa ($40,257, a difference of 0.20%), and Inupiat ($40,080, a difference of 0.24%).
| Demographics | Rating | Rank | Median Female Earnings |
| Immigrants | Chile | 79.6 /100 | #150 | Good $40,353 |
| Immigrants | Armenia | 79.2 /100 | #151 | Good $40,340 |
| West Indians | 78.4 /100 | #152 | Good $40,317 |
| British West Indians | 77.7 /100 | #153 | Good $40,299 |
| Immigrants | Oceania | 77.6 /100 | #154 | Good $40,297 |
| Immigrants | Africa | 76.2 /100 | #155 | Good $40,257 |
| Peruvians | 75.3 /100 | #156 | Good $40,234 |
| Portuguese | 73.0 /100 | #157 | Good $40,177 |
| Immigrants | Senegal | 72.2 /100 | #158 | Good $40,157 |
| Immigrants | Vietnam | 72.0 /100 | #159 | Good $40,153 |
| Inupiat | 68.9 /100 | #160 | Good $40,080 |
| Alsatians | 68.0 /100 | #161 | Good $40,060 |
| South American Indians | 66.1 /100 | #162 | Good $40,019 |
| Lebanese | 65.5 /100 | #163 | Good $40,006 |
| Immigrants | Saudi Arabia | 62.9 /100 | #164 | Good $39,952 |
Demographics Similar to Turks by Median Female Earnings
In terms of median female earnings, the demographic groups most similar to Turks are Immigrants from Russia ($44,680, a difference of 0.030%), Immigrants from Belarus ($44,757, a difference of 0.14%), Immigrants from Sweden ($44,774, a difference of 0.18%), Immigrants from Belgium ($44,587, a difference of 0.24%), and Asian ($44,586, a difference of 0.24%).
| Demographics | Rating | Rank | Median Female Earnings |
| Immigrants | Japan | 100.0 /100 | #20 | Exceptional $45,323 |
| Cambodians | 100.0 /100 | #21 | Exceptional $45,014 |
| Immigrants | Greece | 100.0 /100 | #22 | Exceptional $44,976 |
| Burmese | 100.0 /100 | #23 | Exceptional $44,911 |
| Immigrants | Korea | 100.0 /100 | #24 | Exceptional $44,847 |
| Immigrants | Sweden | 100.0 /100 | #25 | Exceptional $44,774 |
| Immigrants | Belarus | 100.0 /100 | #26 | Exceptional $44,757 |
| Turks | 100.0 /100 | #27 | Exceptional $44,695 |
| Immigrants | Russia | 100.0 /100 | #28 | Exceptional $44,680 |
| Immigrants | Belgium | 100.0 /100 | #29 | Exceptional $44,587 |
| Asians | 100.0 /100 | #30 | Exceptional $44,586 |
| Immigrants | France | 100.0 /100 | #31 | Exceptional $44,541 |
| Immigrants | Northern Europe | 100.0 /100 | #32 | Exceptional $44,366 |
| Immigrants | Asia | 100.0 /100 | #33 | Exceptional $44,198 |
| Russians | 100.0 /100 | #34 | Exceptional $44,169 |