Immigrants from Guyana vs Turkish Median Female Earnings
COMPARE
Immigrants from Guyana
Turkish
Median Female Earnings
Median Female Earnings Comparison
Immigrants from Guyana
Turks
$40,773
MEDIAN FEMALE EARNINGS
90.3/ 100
METRIC RATING
130th/ 347
METRIC RANK
$44,695
MEDIAN FEMALE EARNINGS
100.0/ 100
METRIC RATING
27th/ 347
METRIC RANK
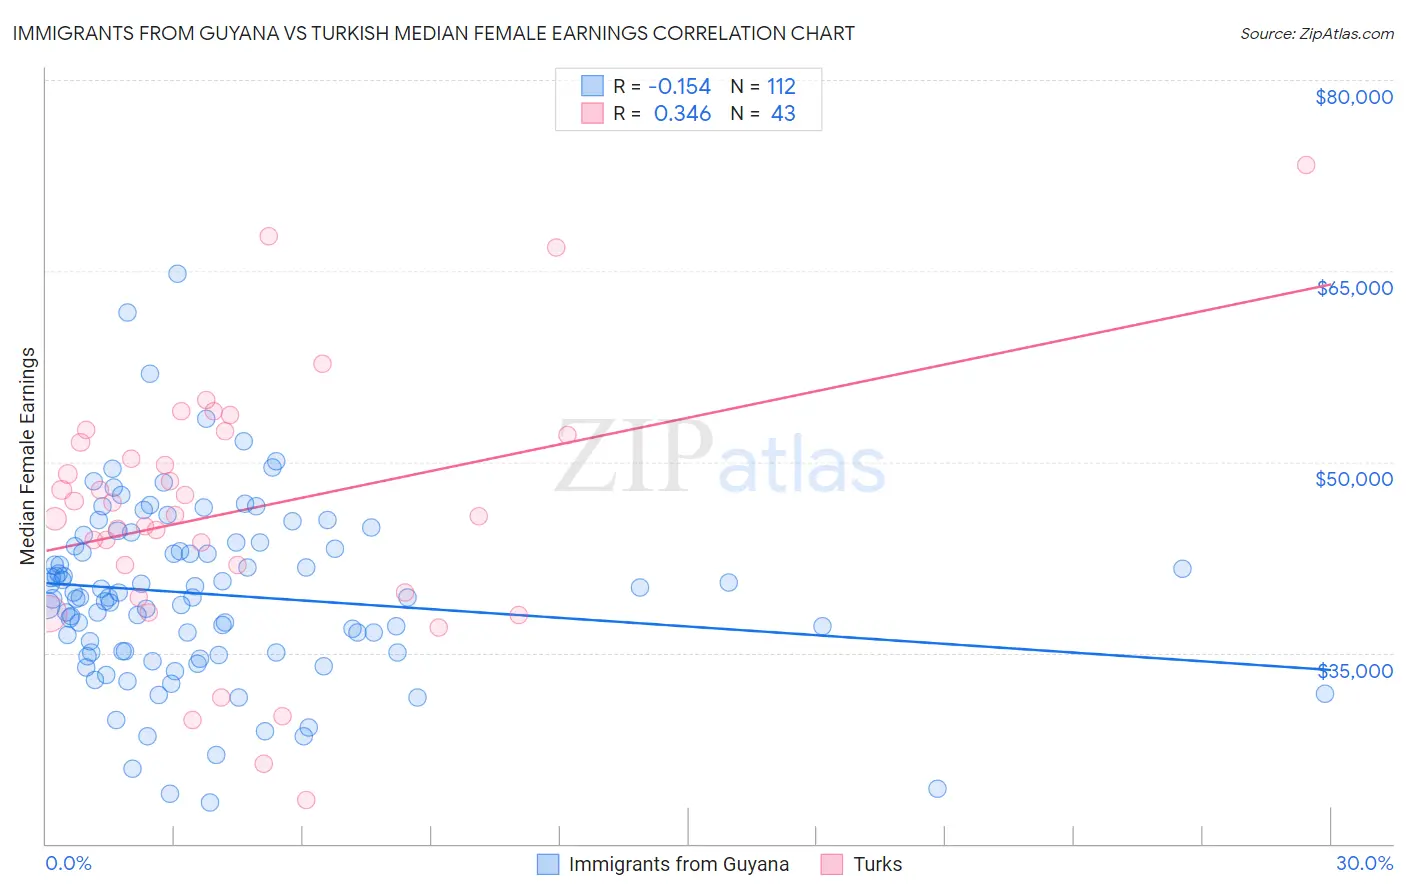
Immigrants from Guyana vs Turkish Median Female Earnings Correlation Chart
The statistical analysis conducted on geographies consisting of 183,689,123 people shows a poor negative correlation between the proportion of Immigrants from Guyana and median female earnings in the United States with a correlation coefficient (R) of -0.154 and weighted average of $40,773. Similarly, the statistical analysis conducted on geographies consisting of 271,816,857 people shows a mild positive correlation between the proportion of Turks and median female earnings in the United States with a correlation coefficient (R) of 0.346 and weighted average of $44,695, a difference of 9.6%.
Median Female Earnings Correlation Summary
| Measurement | Immigrants from Guyana | Turkish |
| Minimum | $23,277 | $23,409 |
| Maximum | $64,779 | $73,333 |
| Range | $41,502 | $49,924 |
| Mean | $39,583 | $46,115 |
| Median | $39,337 | $45,875 |
| Interquartile 25% (IQ1) | $35,009 | $39,746 |
| Interquartile 75% (IQ3) | $43,513 | $52,083 |
| Interquartile Range (IQR) | $8,503 | $12,337 |
| Standard Deviation (Sample) | $7,079 | $10,119 |
| Standard Deviation (Population) | $7,048 | $10,000 |
Similar Demographics by Median Female Earnings
Demographics Similar to Immigrants from Guyana by Median Female Earnings
In terms of median female earnings, the demographic groups most similar to Immigrants from Guyana are Chilean ($40,757, a difference of 0.040%), Zimbabwean ($40,798, a difference of 0.060%), Immigrants from Uganda ($40,739, a difference of 0.080%), Syrian ($40,727, a difference of 0.11%), and Carpatho Rusyn ($40,825, a difference of 0.13%).
| Demographics | Rating | Rank | Median Female Earnings |
| Guyanese | 93.4 /100 | #123 | Exceptional $40,973 |
| Trinidadians and Tobagonians | 93.2 /100 | #124 | Exceptional $40,958 |
| Austrians | 92.7 /100 | #125 | Exceptional $40,923 |
| Immigrants | Trinidad and Tobago | 92.3 /100 | #126 | Exceptional $40,895 |
| Ugandans | 92.2 /100 | #127 | Exceptional $40,889 |
| Carpatho Rusyns | 91.2 /100 | #128 | Exceptional $40,825 |
| Zimbabweans | 90.8 /100 | #129 | Exceptional $40,798 |
| Immigrants | Guyana | 90.3 /100 | #130 | Exceptional $40,773 |
| Chileans | 90.0 /100 | #131 | Exceptional $40,757 |
| Immigrants | Uganda | 89.7 /100 | #132 | Excellent $40,739 |
| Syrians | 89.5 /100 | #133 | Excellent $40,727 |
| Arabs | 89.3 /100 | #134 | Excellent $40,718 |
| Immigrants | Nepal | 89.0 /100 | #135 | Excellent $40,704 |
| Immigrants | Eastern Africa | 87.7 /100 | #136 | Excellent $40,644 |
| Pakistanis | 86.6 /100 | #137 | Excellent $40,596 |
Demographics Similar to Turks by Median Female Earnings
In terms of median female earnings, the demographic groups most similar to Turks are Immigrants from Russia ($44,680, a difference of 0.030%), Immigrants from Belarus ($44,757, a difference of 0.14%), Immigrants from Sweden ($44,774, a difference of 0.18%), Immigrants from Belgium ($44,587, a difference of 0.24%), and Asian ($44,586, a difference of 0.24%).
| Demographics | Rating | Rank | Median Female Earnings |
| Immigrants | Japan | 100.0 /100 | #20 | Exceptional $45,323 |
| Cambodians | 100.0 /100 | #21 | Exceptional $45,014 |
| Immigrants | Greece | 100.0 /100 | #22 | Exceptional $44,976 |
| Burmese | 100.0 /100 | #23 | Exceptional $44,911 |
| Immigrants | Korea | 100.0 /100 | #24 | Exceptional $44,847 |
| Immigrants | Sweden | 100.0 /100 | #25 | Exceptional $44,774 |
| Immigrants | Belarus | 100.0 /100 | #26 | Exceptional $44,757 |
| Turks | 100.0 /100 | #27 | Exceptional $44,695 |
| Immigrants | Russia | 100.0 /100 | #28 | Exceptional $44,680 |
| Immigrants | Belgium | 100.0 /100 | #29 | Exceptional $44,587 |
| Asians | 100.0 /100 | #30 | Exceptional $44,586 |
| Immigrants | France | 100.0 /100 | #31 | Exceptional $44,541 |
| Immigrants | Northern Europe | 100.0 /100 | #32 | Exceptional $44,366 |
| Immigrants | Asia | 100.0 /100 | #33 | Exceptional $44,198 |
| Russians | 100.0 /100 | #34 | Exceptional $44,169 |