Honduran vs Turkish Median Female Earnings
COMPARE
Honduran
Turkish
Median Female Earnings
Median Female Earnings Comparison
Hondurans
Turks
$35,013
MEDIAN FEMALE EARNINGS
0.0/ 100
METRIC RATING
309th/ 347
METRIC RANK
$44,695
MEDIAN FEMALE EARNINGS
100.0/ 100
METRIC RATING
27th/ 347
METRIC RANK
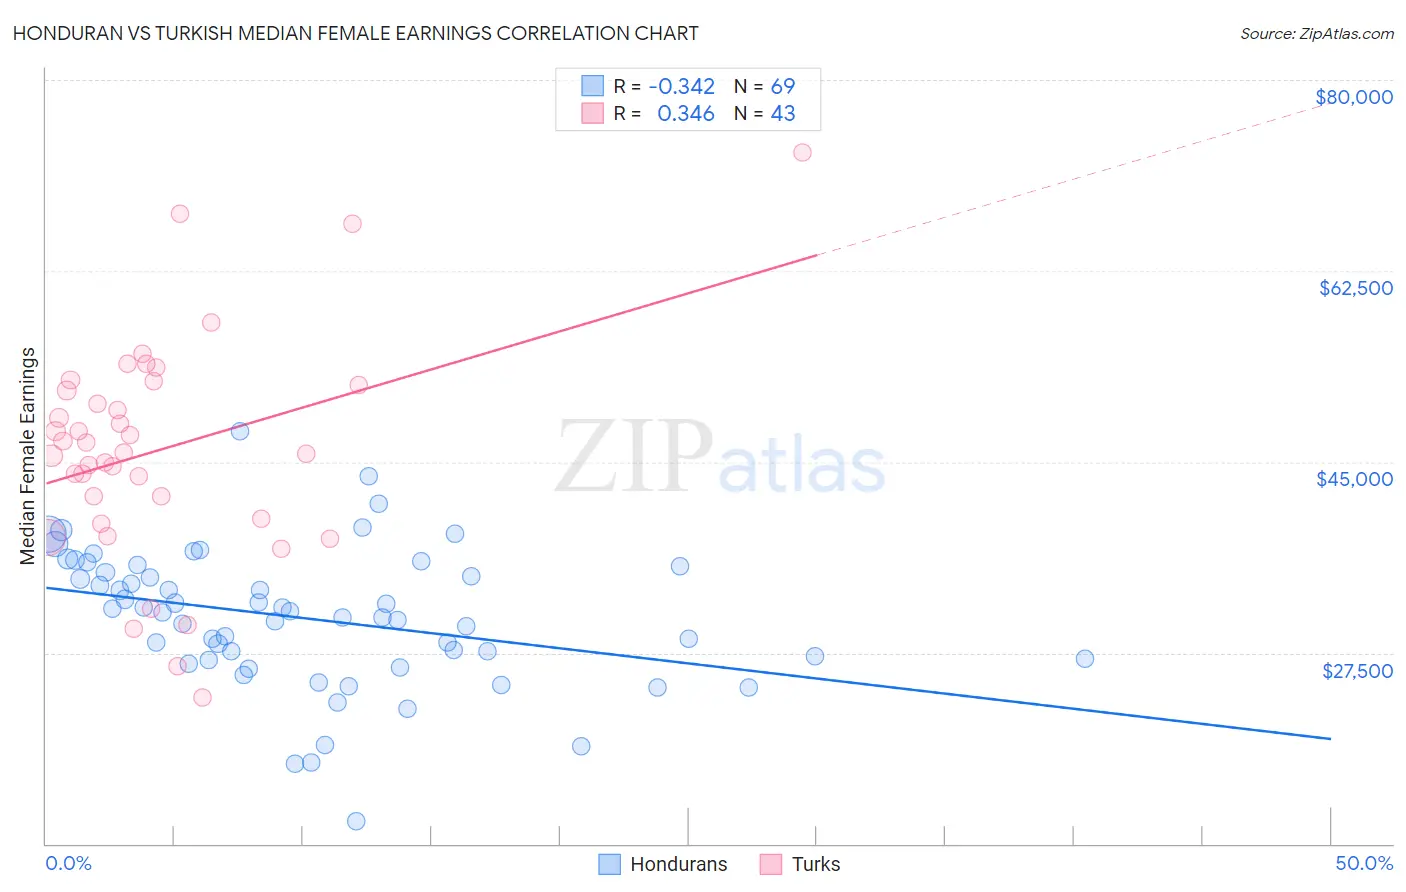
Honduran vs Turkish Median Female Earnings Correlation Chart
The statistical analysis conducted on geographies consisting of 357,702,253 people shows a mild negative correlation between the proportion of Hondurans and median female earnings in the United States with a correlation coefficient (R) of -0.342 and weighted average of $35,013. Similarly, the statistical analysis conducted on geographies consisting of 271,816,857 people shows a mild positive correlation between the proportion of Turks and median female earnings in the United States with a correlation coefficient (R) of 0.346 and weighted average of $44,695, a difference of 27.7%.
Median Female Earnings Correlation Summary
| Measurement | Honduran | Turkish |
| Minimum | $12,102 | $23,409 |
| Maximum | $47,798 | $73,333 |
| Range | $35,696 | $49,924 |
| Mean | $30,670 | $46,115 |
| Median | $31,162 | $45,875 |
| Interquartile 25% (IQ1) | $26,901 | $39,746 |
| Interquartile 75% (IQ3) | $35,123 | $52,083 |
| Interquartile Range (IQR) | $8,221 | $12,337 |
| Standard Deviation (Sample) | $6,330 | $10,119 |
| Standard Deviation (Population) | $6,284 | $10,000 |
Similar Demographics by Median Female Earnings
Demographics Similar to Hondurans by Median Female Earnings
In terms of median female earnings, the demographic groups most similar to Hondurans are Chippewa ($35,003, a difference of 0.030%), Immigrants from Bahamas ($35,027, a difference of 0.040%), Sioux ($35,063, a difference of 0.14%), Ute ($34,960, a difference of 0.15%), and Yaqui ($34,943, a difference of 0.20%).
| Demographics | Rating | Rank | Median Female Earnings |
| Blacks/African Americans | 0.0 /100 | #302 | Tragic $35,315 |
| Immigrants | Latin America | 0.0 /100 | #303 | Tragic $35,307 |
| Crow | 0.0 /100 | #304 | Tragic $35,266 |
| Bahamians | 0.0 /100 | #305 | Tragic $35,125 |
| Fijians | 0.0 /100 | #306 | Tragic $35,114 |
| Sioux | 0.0 /100 | #307 | Tragic $35,063 |
| Immigrants | Bahamas | 0.0 /100 | #308 | Tragic $35,027 |
| Hondurans | 0.0 /100 | #309 | Tragic $35,013 |
| Chippewa | 0.0 /100 | #310 | Tragic $35,003 |
| Ute | 0.0 /100 | #311 | Tragic $34,960 |
| Yaqui | 0.0 /100 | #312 | Tragic $34,943 |
| Cubans | 0.0 /100 | #313 | Tragic $34,942 |
| Apache | 0.0 /100 | #314 | Tragic $34,895 |
| Pennsylvania Germans | 0.0 /100 | #315 | Tragic $34,802 |
| Cherokee | 0.0 /100 | #316 | Tragic $34,742 |
Demographics Similar to Turks by Median Female Earnings
In terms of median female earnings, the demographic groups most similar to Turks are Immigrants from Russia ($44,680, a difference of 0.030%), Immigrants from Belarus ($44,757, a difference of 0.14%), Immigrants from Sweden ($44,774, a difference of 0.18%), Immigrants from Belgium ($44,587, a difference of 0.24%), and Asian ($44,586, a difference of 0.24%).
| Demographics | Rating | Rank | Median Female Earnings |
| Immigrants | Japan | 100.0 /100 | #20 | Exceptional $45,323 |
| Cambodians | 100.0 /100 | #21 | Exceptional $45,014 |
| Immigrants | Greece | 100.0 /100 | #22 | Exceptional $44,976 |
| Burmese | 100.0 /100 | #23 | Exceptional $44,911 |
| Immigrants | Korea | 100.0 /100 | #24 | Exceptional $44,847 |
| Immigrants | Sweden | 100.0 /100 | #25 | Exceptional $44,774 |
| Immigrants | Belarus | 100.0 /100 | #26 | Exceptional $44,757 |
| Turks | 100.0 /100 | #27 | Exceptional $44,695 |
| Immigrants | Russia | 100.0 /100 | #28 | Exceptional $44,680 |
| Immigrants | Belgium | 100.0 /100 | #29 | Exceptional $44,587 |
| Asians | 100.0 /100 | #30 | Exceptional $44,586 |
| Immigrants | France | 100.0 /100 | #31 | Exceptional $44,541 |
| Immigrants | Northern Europe | 100.0 /100 | #32 | Exceptional $44,366 |
| Immigrants | Asia | 100.0 /100 | #33 | Exceptional $44,198 |
| Russians | 100.0 /100 | #34 | Exceptional $44,169 |