Norwegian vs Immigrants from France Median Male Earnings
COMPARE
Norwegian
Immigrants from France
Median Male Earnings
Median Male Earnings Comparison
Norwegians
Immigrants from France
$55,965
MEDIAN MALE EARNINGS
80.9/ 100
METRIC RATING
145th/ 347
METRIC RANK
$63,715
MEDIAN MALE EARNINGS
100.0/ 100
METRIC RATING
30th/ 347
METRIC RANK
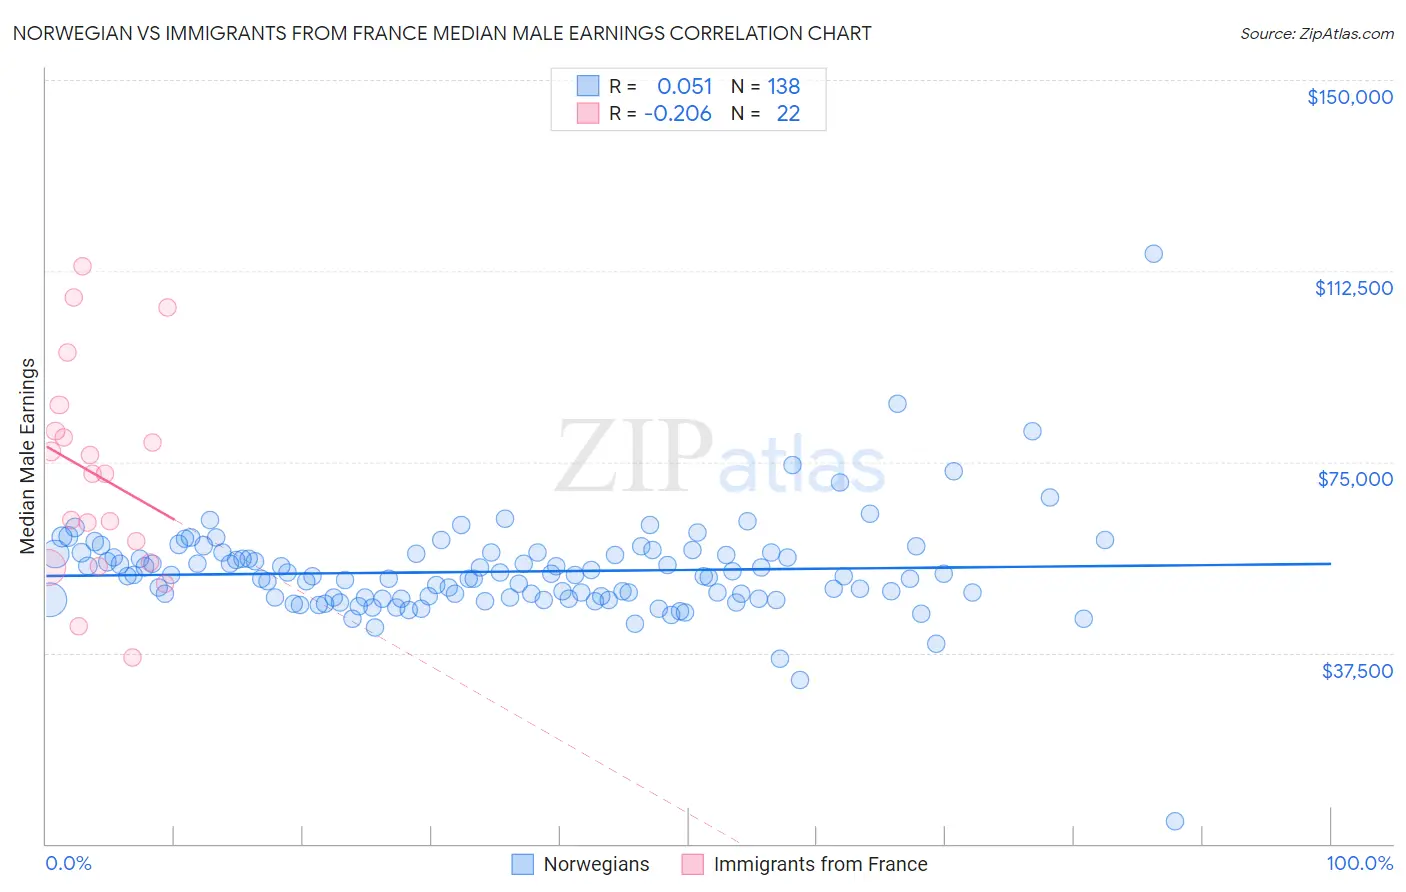
Norwegian vs Immigrants from France Median Male Earnings Correlation Chart
The statistical analysis conducted on geographies consisting of 532,659,369 people shows a slight positive correlation between the proportion of Norwegians and median male earnings in the United States with a correlation coefficient (R) of 0.051 and weighted average of $55,965. Similarly, the statistical analysis conducted on geographies consisting of 287,844,357 people shows a weak negative correlation between the proportion of Immigrants from France and median male earnings in the United States with a correlation coefficient (R) of -0.206 and weighted average of $63,715, a difference of 13.9%.
Median Male Earnings Correlation Summary
| Measurement | Norwegian | Immigrants from France |
| Minimum | $4,318 | $36,667 |
| Maximum | $115,833 | $113,322 |
| Range | $111,515 | $76,655 |
| Mean | $53,449 | $72,320 |
| Median | $52,554 | $72,692 |
| Interquartile 25% (IQ1) | $48,297 | $55,273 |
| Interquartile 75% (IQ3) | $57,158 | $81,126 |
| Interquartile Range (IQR) | $8,861 | $25,853 |
| Standard Deviation (Sample) | $10,042 | $20,619 |
| Standard Deviation (Population) | $10,005 | $20,145 |
Similar Demographics by Median Male Earnings
Demographics Similar to Norwegians by Median Male Earnings
In terms of median male earnings, the demographic groups most similar to Norwegians are Immigrants from Chile ($55,954, a difference of 0.020%), Immigrants from Uganda ($56,064, a difference of 0.18%), Immigrants from Philippines ($55,809, a difference of 0.28%), Sri Lankan ($56,136, a difference of 0.31%), and Scottish ($55,793, a difference of 0.31%).
| Demographics | Rating | Rank | Median Male Earnings |
| Slovaks | 85.5 /100 | #138 | Excellent $56,306 |
| Zimbabweans | 85.5 /100 | #139 | Excellent $56,302 |
| Luxembourgers | 85.5 /100 | #140 | Excellent $56,300 |
| Danes | 84.8 /100 | #141 | Excellent $56,246 |
| Ethiopians | 84.8 /100 | #142 | Excellent $56,243 |
| Sri Lankans | 83.4 /100 | #143 | Excellent $56,136 |
| Immigrants | Uganda | 82.4 /100 | #144 | Excellent $56,064 |
| Norwegians | 80.9 /100 | #145 | Excellent $55,965 |
| Immigrants | Chile | 80.7 /100 | #146 | Excellent $55,954 |
| Immigrants | Philippines | 78.4 /100 | #147 | Good $55,809 |
| Scottish | 78.2 /100 | #148 | Good $55,793 |
| English | 77.4 /100 | #149 | Good $55,747 |
| Swiss | 77.1 /100 | #150 | Good $55,731 |
| Immigrants | Oceania | 76.8 /100 | #151 | Good $55,712 |
| Peruvians | 75.8 /100 | #152 | Good $55,659 |
Demographics Similar to Immigrants from France by Median Male Earnings
In terms of median male earnings, the demographic groups most similar to Immigrants from France are Asian ($63,827, a difference of 0.18%), Latvian ($63,498, a difference of 0.34%), Russian ($63,939, a difference of 0.35%), Immigrants from Switzerland ($63,944, a difference of 0.36%), and Soviet Union ($63,382, a difference of 0.53%).
| Demographics | Rating | Rank | Median Male Earnings |
| Immigrants | Korea | 100.0 /100 | #23 | Exceptional $65,079 |
| Immigrants | Northern Europe | 100.0 /100 | #24 | Exceptional $64,987 |
| Immigrants | Denmark | 100.0 /100 | #25 | Exceptional $64,625 |
| Turks | 100.0 /100 | #26 | Exceptional $64,253 |
| Immigrants | Switzerland | 100.0 /100 | #27 | Exceptional $63,944 |
| Russians | 100.0 /100 | #28 | Exceptional $63,939 |
| Asians | 100.0 /100 | #29 | Exceptional $63,827 |
| Immigrants | France | 100.0 /100 | #30 | Exceptional $63,715 |
| Latvians | 100.0 /100 | #31 | Exceptional $63,498 |
| Soviet Union | 100.0 /100 | #32 | Exceptional $63,382 |
| Immigrants | Lithuania | 100.0 /100 | #33 | Exceptional $63,346 |
| Immigrants | Russia | 100.0 /100 | #34 | Exceptional $63,326 |
| Immigrants | Asia | 100.0 /100 | #35 | Exceptional $63,240 |
| Israelis | 100.0 /100 | #36 | Exceptional $63,228 |
| Immigrants | Sri Lanka | 100.0 /100 | #37 | Exceptional $63,099 |