Alaskan Athabascan vs Sudanese Master's Degree
COMPARE
Alaskan Athabascan
Sudanese
Master's Degree
Master's Degree Comparison
Alaskan Athabascans
Sudanese
11.6%
MASTER'S DEGREE
0.1/ 100
METRIC RATING
296th/ 347
METRIC RANK
15.3%
MASTER'S DEGREE
68.7/ 100
METRIC RATING
161st/ 347
METRIC RANK
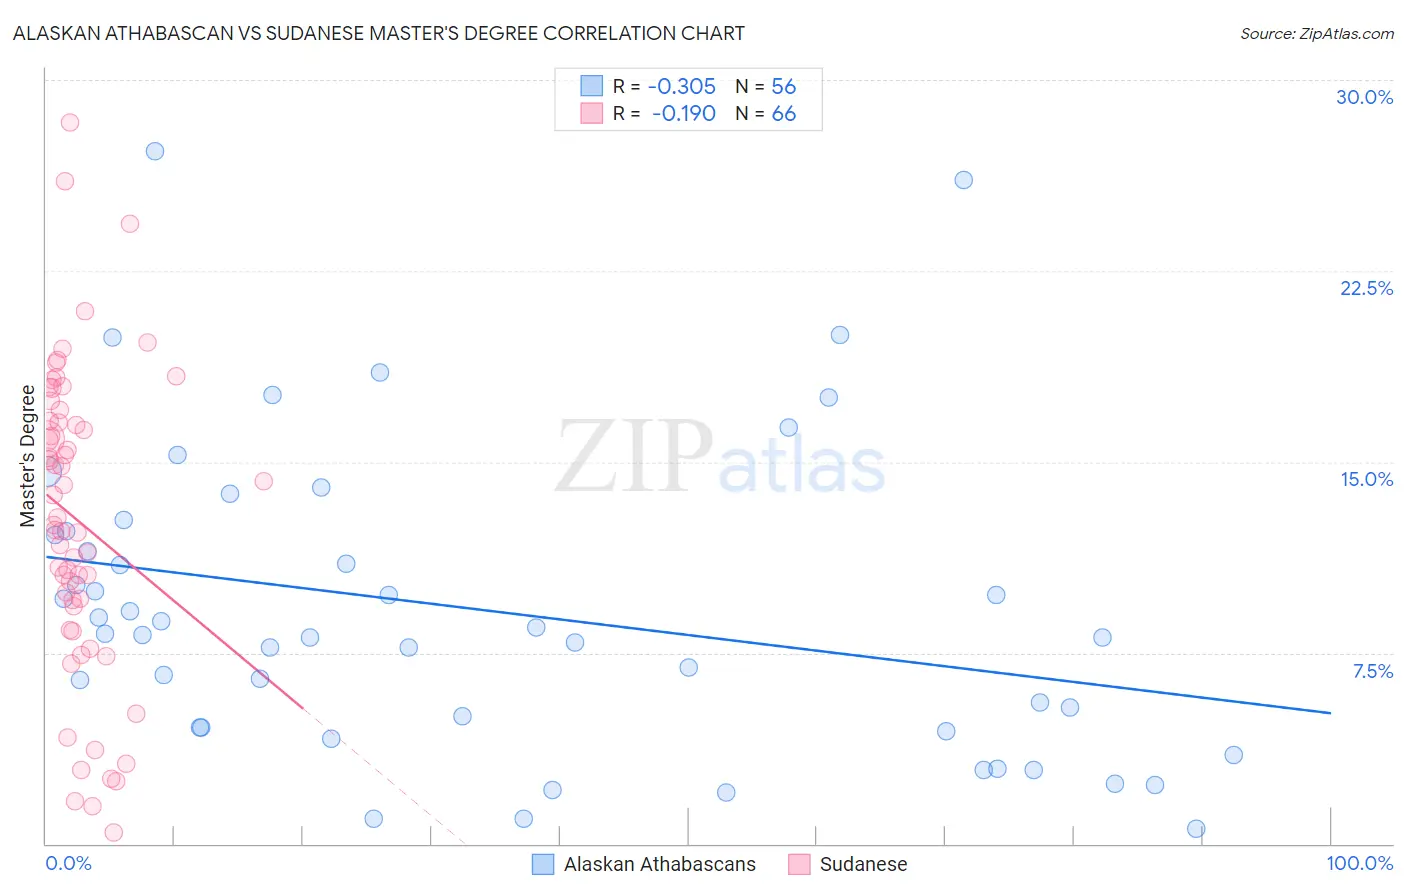
Alaskan Athabascan vs Sudanese Master's Degree Correlation Chart
The statistical analysis conducted on geographies consisting of 45,807,187 people shows a mild negative correlation between the proportion of Alaskan Athabascans and percentage of population with at least master's degree education in the United States with a correlation coefficient (R) of -0.305 and weighted average of 11.6%. Similarly, the statistical analysis conducted on geographies consisting of 110,110,663 people shows a poor negative correlation between the proportion of Sudanese and percentage of population with at least master's degree education in the United States with a correlation coefficient (R) of -0.190 and weighted average of 15.3%, a difference of 32.2%.
Master's Degree Correlation Summary
| Measurement | Alaskan Athabascan | Sudanese |
| Minimum | 0.59% | 0.44% |
| Maximum | 27.2% | 28.3% |
| Range | 26.6% | 27.9% |
| Mean | 9.2% | 12.7% |
| Median | 8.2% | 12.7% |
| Interquartile 25% (IQ1) | 4.6% | 9.3% |
| Interquartile 75% (IQ3) | 12.2% | 16.6% |
| Interquartile Range (IQR) | 7.6% | 7.3% |
| Standard Deviation (Sample) | 6.0% | 6.0% |
| Standard Deviation (Population) | 6.0% | 6.0% |
Similar Demographics by Master's Degree
Demographics Similar to Alaskan Athabascans by Master's Degree
In terms of master's degree, the demographic groups most similar to Alaskan Athabascans are Marshallese (11.6%, a difference of 0.010%), Immigrants from Yemen (11.6%, a difference of 0.12%), Hawaiian (11.6%, a difference of 0.16%), Alaska Native (11.6%, a difference of 0.26%), and Immigrants from Guatemala (11.6%, a difference of 0.48%).
| Demographics | Rating | Rank | Master's Degree |
| Guatemalans | 0.1 /100 | #289 | Tragic 11.7% |
| Ute | 0.1 /100 | #290 | Tragic 11.7% |
| Colville | 0.1 /100 | #291 | Tragic 11.6% |
| Immigrants | Guatemala | 0.1 /100 | #292 | Tragic 11.6% |
| Alaska Natives | 0.1 /100 | #293 | Tragic 11.6% |
| Hawaiians | 0.1 /100 | #294 | Tragic 11.6% |
| Marshallese | 0.1 /100 | #295 | Tragic 11.6% |
| Alaskan Athabascans | 0.1 /100 | #296 | Tragic 11.6% |
| Immigrants | Yemen | 0.1 /100 | #297 | Tragic 11.6% |
| Samoans | 0.1 /100 | #298 | Tragic 11.5% |
| Chickasaw | 0.1 /100 | #299 | Tragic 11.4% |
| Chippewa | 0.1 /100 | #300 | Tragic 11.4% |
| Tsimshian | 0.1 /100 | #301 | Tragic 11.4% |
| Cherokee | 0.1 /100 | #302 | Tragic 11.4% |
| Immigrants | Laos | 0.1 /100 | #303 | Tragic 11.4% |
Demographics Similar to Sudanese by Master's Degree
In terms of master's degree, the demographic groups most similar to Sudanese are Peruvian (15.3%, a difference of 0.010%), Kenyan (15.3%, a difference of 0.23%), Uruguayan (15.3%, a difference of 0.23%), Colombian (15.3%, a difference of 0.26%), and Immigrants from Kenya (15.3%, a difference of 0.30%).
| Demographics | Rating | Rank | Master's Degree |
| Immigrants | South America | 76.3 /100 | #154 | Good 15.5% |
| Immigrants | Bangladesh | 76.1 /100 | #155 | Good 15.5% |
| Bermudans | 73.9 /100 | #156 | Good 15.4% |
| Immigrants | Cameroon | 71.7 /100 | #157 | Good 15.4% |
| Immigrants | Poland | 71.5 /100 | #158 | Good 15.4% |
| Luxembourgers | 71.0 /100 | #159 | Good 15.3% |
| Kenyans | 70.3 /100 | #160 | Good 15.3% |
| Sudanese | 68.7 /100 | #161 | Good 15.3% |
| Peruvians | 68.7 /100 | #162 | Good 15.3% |
| Uruguayans | 67.1 /100 | #163 | Good 15.3% |
| Colombians | 66.9 /100 | #164 | Good 15.3% |
| Immigrants | Kenya | 66.6 /100 | #165 | Good 15.3% |
| Swedes | 66.1 /100 | #166 | Good 15.2% |
| Senegalese | 65.6 /100 | #167 | Good 15.2% |
| Immigrants | North Macedonia | 64.5 /100 | #168 | Good 15.2% |