Alaskan Athabascan vs Immigrants from Barbados Median Household Income
COMPARE
Alaskan Athabascan
Immigrants from Barbados
Median Household Income
Median Household Income Comparison
Alaskan Athabascans
Immigrants from Barbados
$76,383
MEDIAN HOUSEHOLD INCOME
0.4/ 100
METRIC RATING
263rd/ 347
METRIC RANK
$78,989
MEDIAN HOUSEHOLD INCOME
1.9/ 100
METRIC RATING
243rd/ 347
METRIC RANK
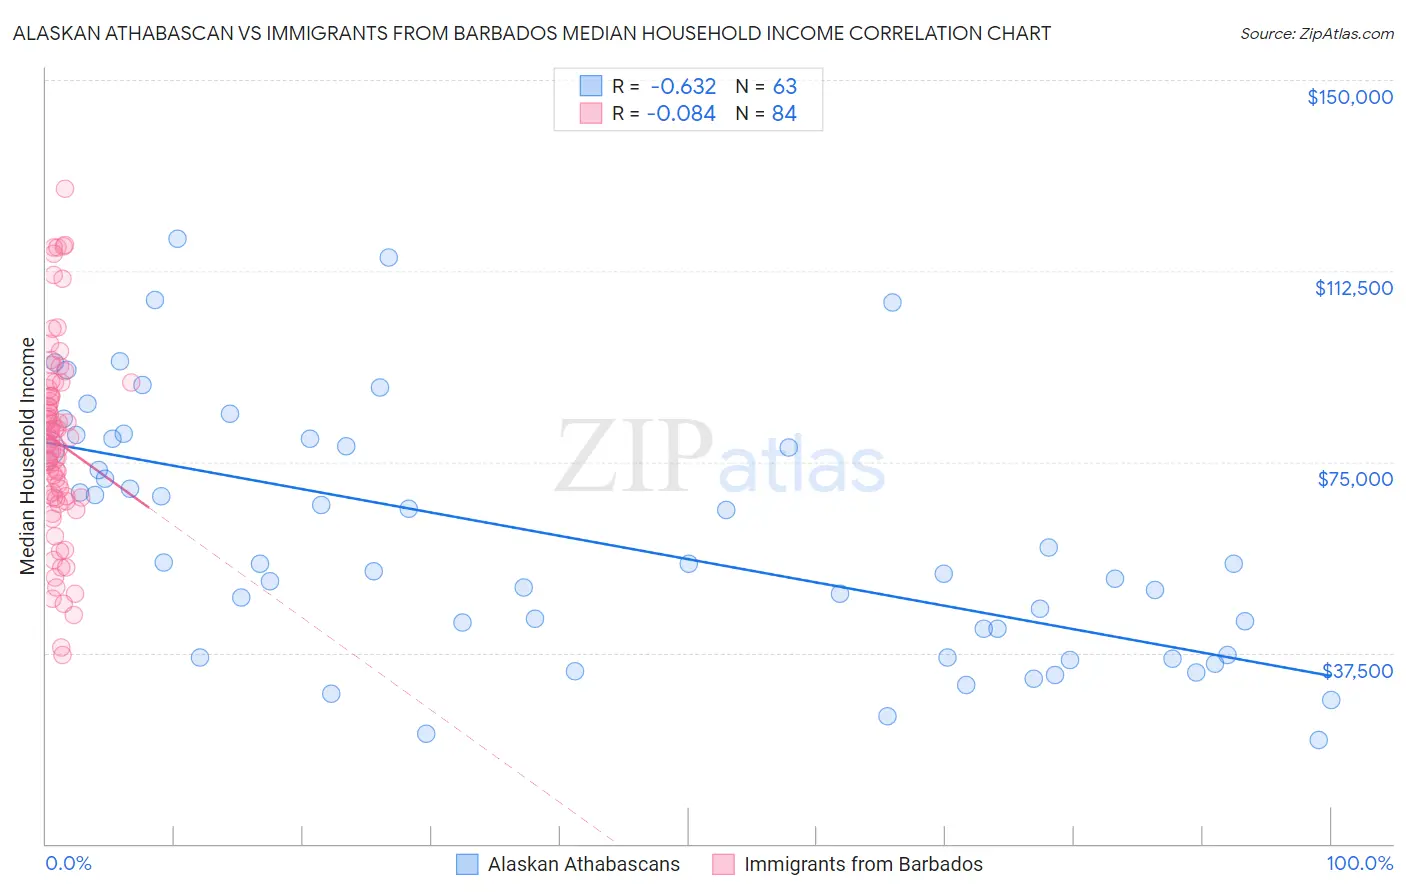
Alaskan Athabascan vs Immigrants from Barbados Median Household Income Correlation Chart
The statistical analysis conducted on geographies consisting of 45,812,420 people shows a significant negative correlation between the proportion of Alaskan Athabascans and median household income in the United States with a correlation coefficient (R) of -0.632 and weighted average of $76,383. Similarly, the statistical analysis conducted on geographies consisting of 112,738,981 people shows a slight negative correlation between the proportion of Immigrants from Barbados and median household income in the United States with a correlation coefficient (R) of -0.084 and weighted average of $78,989, a difference of 3.4%.
Median Household Income Correlation Summary
| Measurement | Alaskan Athabascan | Immigrants from Barbados |
| Minimum | $20,417 | $37,105 |
| Maximum | $118,934 | $128,750 |
| Range | $98,517 | $91,645 |
| Mean | $60,171 | $78,963 |
| Median | $55,000 | $79,093 |
| Interquartile 25% (IQ1) | $36,964 | $67,974 |
| Interquartile 75% (IQ3) | $79,438 | $88,607 |
| Interquartile Range (IQR) | $42,474 | $20,633 |
| Standard Deviation (Sample) | $24,397 | $18,879 |
| Standard Deviation (Population) | $24,203 | $18,767 |
Demographics Similar to Alaskan Athabascans and Immigrants from Barbados by Median Household Income
In terms of median household income, the demographic groups most similar to Alaskan Athabascans are French American Indian ($76,387, a difference of 0.010%), Immigrants from Grenada ($76,517, a difference of 0.18%), Jamaican ($76,583, a difference of 0.26%), Spanish American Indian ($76,670, a difference of 0.38%), and Immigrants from Nicaragua ($76,784, a difference of 0.52%). Similarly, the demographic groups most similar to Immigrants from Barbados are Marshallese ($78,930, a difference of 0.080%), Inupiat ($78,841, a difference of 0.19%), Central American ($78,803, a difference of 0.24%), Immigrants from Burma/Myanmar ($78,682, a difference of 0.39%), and Sudanese ($78,529, a difference of 0.59%).
| Demographics | Rating | Rank | Median Household Income |
| Immigrants | Barbados | 1.9 /100 | #243 | Tragic $78,989 |
| Marshallese | 1.9 /100 | #244 | Tragic $78,930 |
| Inupiat | 1.8 /100 | #245 | Tragic $78,841 |
| Central Americans | 1.7 /100 | #246 | Tragic $78,803 |
| Immigrants | Burma/Myanmar | 1.6 /100 | #247 | Tragic $78,682 |
| Sudanese | 1.5 /100 | #248 | Tragic $78,529 |
| West Indians | 1.4 /100 | #249 | Tragic $78,455 |
| Immigrants | Laos | 1.3 /100 | #250 | Tragic $78,327 |
| Mexican American Indians | 1.2 /100 | #251 | Tragic $78,166 |
| Immigrants | West Indies | 1.0 /100 | #252 | Tragic $77,956 |
| Immigrants | St. Vincent and the Grenadines | 0.9 /100 | #253 | Tragic $77,690 |
| Sub-Saharan Africans | 0.8 /100 | #254 | Tragic $77,631 |
| Immigrants | Middle Africa | 0.8 /100 | #255 | Tragic $77,559 |
| Belizeans | 0.6 /100 | #256 | Tragic $77,028 |
| Immigrants | Senegal | 0.5 /100 | #257 | Tragic $76,915 |
| Immigrants | Nicaragua | 0.5 /100 | #258 | Tragic $76,784 |
| Spanish American Indians | 0.4 /100 | #259 | Tragic $76,670 |
| Jamaicans | 0.4 /100 | #260 | Tragic $76,583 |
| Immigrants | Grenada | 0.4 /100 | #261 | Tragic $76,517 |
| French American Indians | 0.4 /100 | #262 | Tragic $76,387 |
| Alaskan Athabascans | 0.4 /100 | #263 | Tragic $76,383 |