American vs Immigrants from Barbados Median Male Earnings
COMPARE
American
Immigrants from Barbados
Median Male Earnings
Median Male Earnings Comparison
Americans
Immigrants from Barbados
$50,761
MEDIAN MALE EARNINGS
2.5/ 100
METRIC RATING
239th/ 347
METRIC RANK
$50,795
MEDIAN MALE EARNINGS
2.6/ 100
METRIC RATING
237th/ 347
METRIC RANK
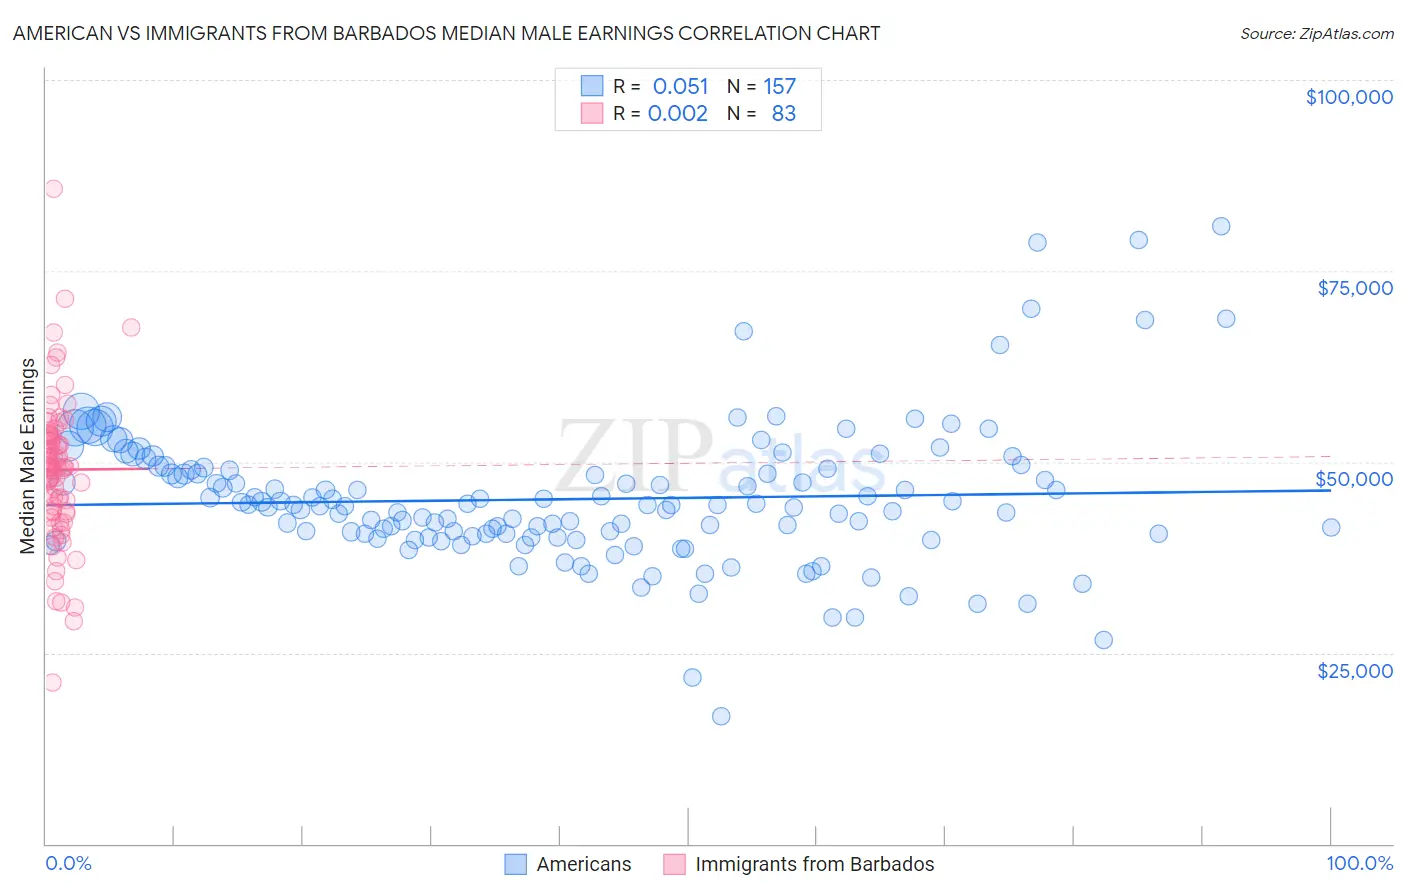
American vs Immigrants from Barbados Median Male Earnings Correlation Chart
The statistical analysis conducted on geographies consisting of 580,042,530 people shows a slight positive correlation between the proportion of Americans and median male earnings in the United States with a correlation coefficient (R) of 0.051 and weighted average of $50,761. Similarly, the statistical analysis conducted on geographies consisting of 112,696,118 people shows no correlation between the proportion of Immigrants from Barbados and median male earnings in the United States with a correlation coefficient (R) of 0.002 and weighted average of $50,795, a difference of 0.070%.
Median Male Earnings Correlation Summary
| Measurement | American | Immigrants from Barbados |
| Minimum | $16,756 | $21,184 |
| Maximum | $80,855 | $85,682 |
| Range | $64,099 | $64,498 |
| Mean | $45,104 | $48,967 |
| Median | $44,329 | $49,260 |
| Interquartile 25% (IQ1) | $40,142 | $43,464 |
| Interquartile 75% (IQ3) | $48,927 | $53,363 |
| Interquartile Range (IQR) | $8,785 | $9,899 |
| Standard Deviation (Sample) | $9,213 | $9,605 |
| Standard Deviation (Population) | $9,183 | $9,547 |
Demographics Similar to Americans and Immigrants from Barbados by Median Male Earnings
In terms of median male earnings, the demographic groups most similar to Americans are Malaysian ($50,772, a difference of 0.020%), West Indian ($50,682, a difference of 0.16%), Immigrants from St. Vincent and the Grenadines ($50,665, a difference of 0.19%), Pennsylvania German ($50,878, a difference of 0.23%), and Guyanese ($50,613, a difference of 0.29%). Similarly, the demographic groups most similar to Immigrants from Barbados are Malaysian ($50,772, a difference of 0.050%), Pennsylvania German ($50,878, a difference of 0.16%), West Indian ($50,682, a difference of 0.22%), Immigrants from St. Vincent and the Grenadines ($50,665, a difference of 0.26%), and Immigrants from Western Africa ($50,940, a difference of 0.28%).
| Demographics | Rating | Rank | Median Male Earnings |
| Samoans | 4.6 /100 | #228 | Tragic $51,389 |
| Immigrants | Trinidad and Tobago | 4.5 /100 | #229 | Tragic $51,376 |
| Immigrants | Nigeria | 4.2 /100 | #230 | Tragic $51,310 |
| Barbadians | 3.9 /100 | #231 | Tragic $51,236 |
| Sudanese | 3.9 /100 | #232 | Tragic $51,216 |
| Aleuts | 3.7 /100 | #233 | Tragic $51,168 |
| Cape Verdeans | 3.5 /100 | #234 | Tragic $51,103 |
| Immigrants | Western Africa | 3.0 /100 | #235 | Tragic $50,940 |
| Pennsylvania Germans | 2.8 /100 | #236 | Tragic $50,878 |
| Immigrants | Barbados | 2.6 /100 | #237 | Tragic $50,795 |
| Malaysians | 2.5 /100 | #238 | Tragic $50,772 |
| Americans | 2.5 /100 | #239 | Tragic $50,761 |
| West Indians | 2.3 /100 | #240 | Tragic $50,682 |
| Immigrants | St. Vincent and the Grenadines | 2.3 /100 | #241 | Tragic $50,665 |
| Guyanese | 2.2 /100 | #242 | Tragic $50,613 |
| French American Indians | 2.2 /100 | #243 | Tragic $50,611 |
| Houma | 2.0 /100 | #244 | Tragic $50,547 |
| Hawaiians | 1.9 /100 | #245 | Tragic $50,488 |
| Immigrants | Ecuador | 1.9 /100 | #246 | Tragic $50,474 |
| Sub-Saharan Africans | 1.8 /100 | #247 | Tragic $50,408 |
| Immigrants | Guyana | 1.6 /100 | #248 | Tragic $50,321 |