Immigrants from Panama vs Immigrants from Barbados Median Male Earnings
COMPARE
Immigrants from Panama
Immigrants from Barbados
Median Male Earnings
Median Male Earnings Comparison
Immigrants from Panama
Immigrants from Barbados
$51,962
MEDIAN MALE EARNINGS
7.7/ 100
METRIC RATING
218th/ 347
METRIC RANK
$50,795
MEDIAN MALE EARNINGS
2.6/ 100
METRIC RATING
237th/ 347
METRIC RANK
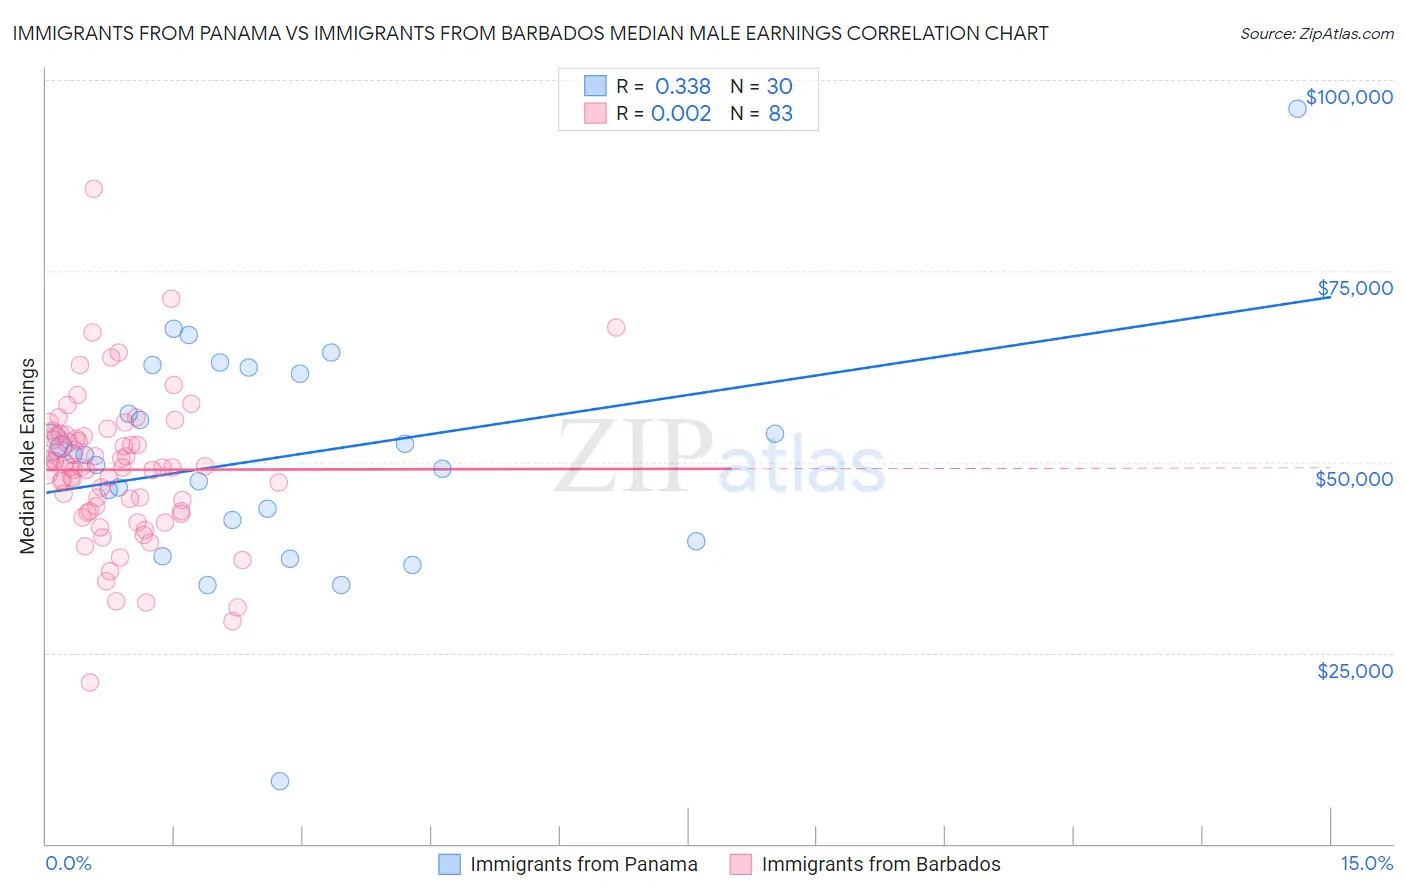
Immigrants from Panama vs Immigrants from Barbados Median Male Earnings Correlation Chart
The statistical analysis conducted on geographies consisting of 221,157,790 people shows a mild positive correlation between the proportion of Immigrants from Panama and median male earnings in the United States with a correlation coefficient (R) of 0.338 and weighted average of $51,962. Similarly, the statistical analysis conducted on geographies consisting of 112,696,118 people shows no correlation between the proportion of Immigrants from Barbados and median male earnings in the United States with a correlation coefficient (R) of 0.002 and weighted average of $50,795, a difference of 2.3%.
Median Male Earnings Correlation Summary
| Measurement | Immigrants from Panama | Immigrants from Barbados |
| Minimum | $8,214 | $21,184 |
| Maximum | $96,250 | $85,682 |
| Range | $88,036 | $64,498 |
| Mean | $50,691 | $48,967 |
| Median | $50,981 | $49,260 |
| Interquartile 25% (IQ1) | $42,361 | $43,464 |
| Interquartile 75% (IQ3) | $61,515 | $53,363 |
| Interquartile Range (IQR) | $19,154 | $9,899 |
| Standard Deviation (Sample) | $15,111 | $9,605 |
| Standard Deviation (Population) | $14,857 | $9,547 |
Demographics Similar to Immigrants from Panama and Immigrants from Barbados by Median Male Earnings
In terms of median male earnings, the demographic groups most similar to Immigrants from Panama are Nigerian ($52,039, a difference of 0.15%), Immigrants from Ghana ($51,836, a difference of 0.24%), Immigrants from Armenia ($51,793, a difference of 0.33%), Immigrants from Senegal ($51,647, a difference of 0.61%), and Immigrants from Bangladesh ($51,642, a difference of 0.62%). Similarly, the demographic groups most similar to Immigrants from Barbados are Pennsylvania German ($50,878, a difference of 0.16%), Immigrants from Western Africa ($50,940, a difference of 0.28%), Cape Verdean ($51,103, a difference of 0.61%), Aleut ($51,168, a difference of 0.73%), and Sudanese ($51,216, a difference of 0.83%).
| Demographics | Rating | Rank | Median Male Earnings |
| Nigerians | 8.3 /100 | #217 | Tragic $52,039 |
| Immigrants | Panama | 7.7 /100 | #218 | Tragic $51,962 |
| Immigrants | Ghana | 6.9 /100 | #219 | Tragic $51,836 |
| Immigrants | Armenia | 6.6 /100 | #220 | Tragic $51,793 |
| Immigrants | Senegal | 5.8 /100 | #221 | Tragic $51,647 |
| Immigrants | Bangladesh | 5.8 /100 | #222 | Tragic $51,642 |
| Ecuadorians | 5.5 /100 | #223 | Tragic $51,596 |
| Immigrants | Cambodia | 5.5 /100 | #224 | Tragic $51,594 |
| Immigrants | Sudan | 5.0 /100 | #225 | Tragic $51,489 |
| Japanese | 4.9 /100 | #226 | Tragic $51,473 |
| Trinidadians and Tobagonians | 4.8 /100 | #227 | Tragic $51,446 |
| Samoans | 4.6 /100 | #228 | Tragic $51,389 |
| Immigrants | Trinidad and Tobago | 4.5 /100 | #229 | Tragic $51,376 |
| Immigrants | Nigeria | 4.2 /100 | #230 | Tragic $51,310 |
| Barbadians | 3.9 /100 | #231 | Tragic $51,236 |
| Sudanese | 3.9 /100 | #232 | Tragic $51,216 |
| Aleuts | 3.7 /100 | #233 | Tragic $51,168 |
| Cape Verdeans | 3.5 /100 | #234 | Tragic $51,103 |
| Immigrants | Western Africa | 3.0 /100 | #235 | Tragic $50,940 |
| Pennsylvania Germans | 2.8 /100 | #236 | Tragic $50,878 |
| Immigrants | Barbados | 2.6 /100 | #237 | Tragic $50,795 |