Colombian vs Immigrants from Congo Median Female Earnings
COMPARE
Colombian
Immigrants from Congo
Median Female Earnings
Median Female Earnings Comparison
Colombians
Immigrants from Congo
$39,439
MEDIAN FEMALE EARNINGS
36.9/ 100
METRIC RATING
186th/ 347
METRIC RANK
$34,317
MEDIAN FEMALE EARNINGS
0.0/ 100
METRIC RATING
324th/ 347
METRIC RANK
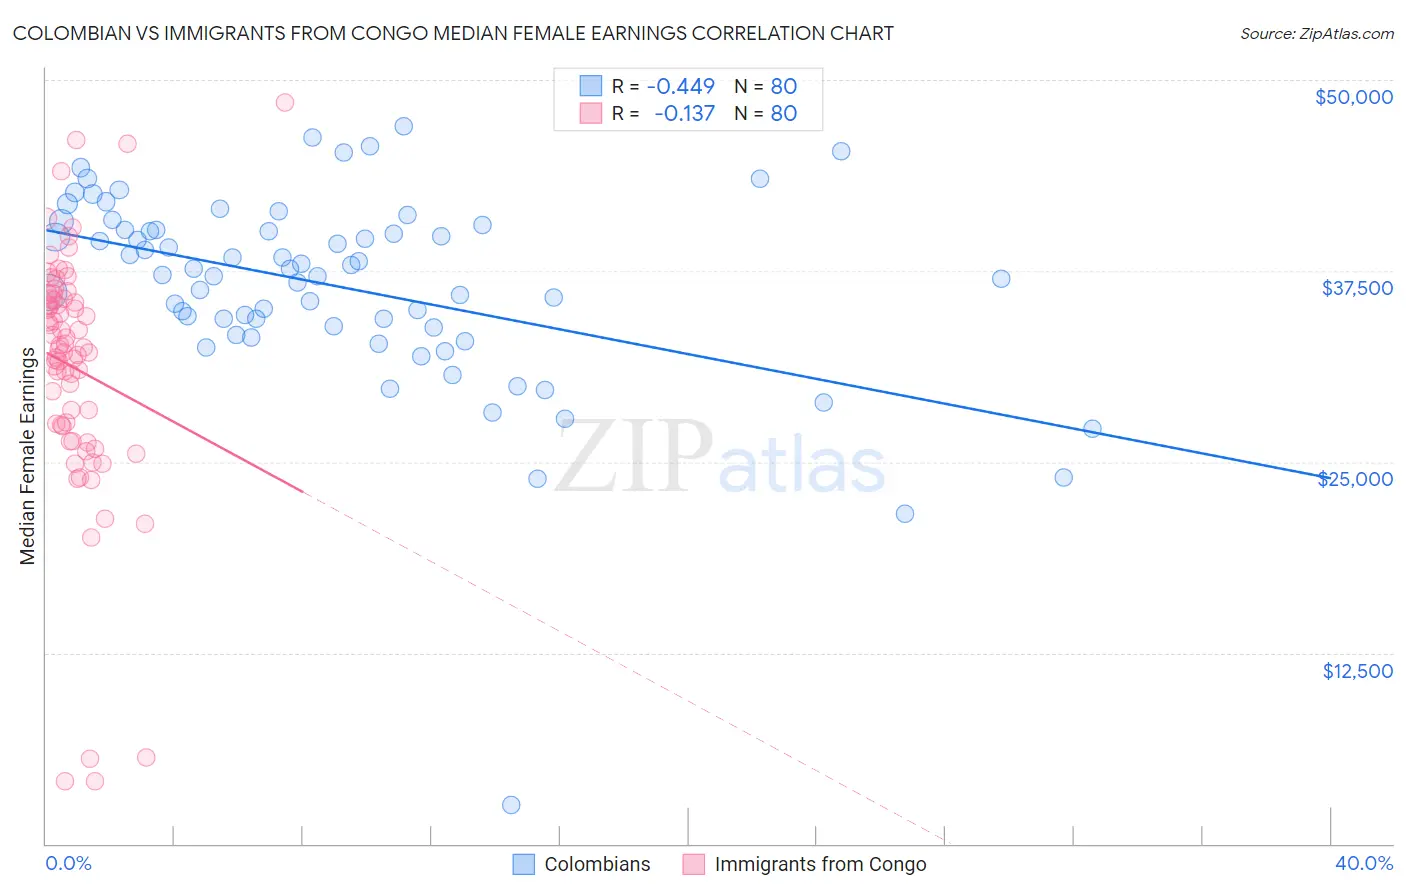
Colombian vs Immigrants from Congo Median Female Earnings Correlation Chart
The statistical analysis conducted on geographies consisting of 419,536,375 people shows a moderate negative correlation between the proportion of Colombians and median female earnings in the United States with a correlation coefficient (R) of -0.449 and weighted average of $39,439. Similarly, the statistical analysis conducted on geographies consisting of 92,121,393 people shows a poor negative correlation between the proportion of Immigrants from Congo and median female earnings in the United States with a correlation coefficient (R) of -0.137 and weighted average of $34,317, a difference of 14.9%.
Median Female Earnings Correlation Summary
| Measurement | Colombian | Immigrants from Congo |
| Minimum | $2,499 | $4,095 |
| Maximum | $46,974 | $48,487 |
| Range | $44,475 | $44,392 |
| Mean | $36,461 | $31,171 |
| Median | $37,418 | $32,459 |
| Interquartile 25% (IQ1) | $33,852 | $27,374 |
| Interquartile 75% (IQ3) | $40,193 | $35,656 |
| Interquartile Range (IQR) | $6,341 | $8,283 |
| Standard Deviation (Sample) | $6,518 | $8,300 |
| Standard Deviation (Population) | $6,477 | $8,248 |
Similar Demographics by Median Female Earnings
Demographics Similar to Colombians by Median Female Earnings
In terms of median female earnings, the demographic groups most similar to Colombians are Immigrants from West Indies ($39,441, a difference of 0.0%), European ($39,457, a difference of 0.040%), Swedish ($39,421, a difference of 0.050%), Bermudan ($39,418, a difference of 0.050%), and Senegalese ($39,384, a difference of 0.14%).
| Demographics | Rating | Rank | Median Female Earnings |
| Immigrants | Germany | 45.1 /100 | #179 | Average $39,603 |
| Immigrants | Kenya | 41.6 /100 | #180 | Average $39,535 |
| Tsimshian | 41.4 /100 | #181 | Average $39,530 |
| Tlingit-Haida | 40.5 /100 | #182 | Average $39,513 |
| Hungarians | 40.3 /100 | #183 | Average $39,510 |
| Europeans | 37.7 /100 | #184 | Fair $39,457 |
| Immigrants | West Indies | 36.9 /100 | #185 | Fair $39,441 |
| Colombians | 36.9 /100 | #186 | Fair $39,439 |
| Swedes | 36.0 /100 | #187 | Fair $39,421 |
| Bermudans | 35.9 /100 | #188 | Fair $39,418 |
| Senegalese | 34.2 /100 | #189 | Fair $39,384 |
| Puget Sound Salish | 33.9 /100 | #190 | Fair $39,376 |
| Immigrants | Western Africa | 32.7 /100 | #191 | Fair $39,351 |
| Immigrants | Immigrants | 31.7 /100 | #192 | Fair $39,328 |
| Immigrants | Nigeria | 30.2 /100 | #193 | Fair $39,294 |
Demographics Similar to Immigrants from Congo by Median Female Earnings
In terms of median female earnings, the demographic groups most similar to Immigrants from Congo are Seminole ($34,385, a difference of 0.20%), Chickasaw ($34,414, a difference of 0.28%), Hispanic or Latino ($34,421, a difference of 0.31%), Dutch West Indian ($34,106, a difference of 0.62%), and Kiowa ($34,074, a difference of 0.71%).
| Demographics | Rating | Rank | Median Female Earnings |
| Potawatomi | 0.0 /100 | #317 | Tragic $34,739 |
| Immigrants | Yemen | 0.0 /100 | #318 | Tragic $34,693 |
| Shoshone | 0.0 /100 | #319 | Tragic $34,677 |
| Immigrants | Honduras | 0.0 /100 | #320 | Tragic $34,647 |
| Hispanics or Latinos | 0.0 /100 | #321 | Tragic $34,421 |
| Chickasaw | 0.0 /100 | #322 | Tragic $34,414 |
| Seminole | 0.0 /100 | #323 | Tragic $34,385 |
| Immigrants | Congo | 0.0 /100 | #324 | Tragic $34,317 |
| Dutch West Indians | 0.0 /100 | #325 | Tragic $34,106 |
| Kiowa | 0.0 /100 | #326 | Tragic $34,074 |
| Cajuns | 0.0 /100 | #327 | Tragic $34,034 |
| Immigrants | Central America | 0.0 /100 | #328 | Tragic $33,953 |
| Hopi | 0.0 /100 | #329 | Tragic $33,932 |
| Menominee | 0.0 /100 | #330 | Tragic $33,894 |
| Natives/Alaskans | 0.0 /100 | #331 | Tragic $33,806 |